It is a common misconception that day trading is a relatively new practice.
Many young traders believe that day trading first began when online trading platforms were developed. Even the most senior traders could be forgiven for believing that day trading is an activity confined to the last 100 years.
In reality, day trading can be traced as far back as 1867. To put this into context, 1867 is only two years after the death of Abraham Lincoln.
When day trading began, the telegraph was the revolutionary communication technology of the day, and traders used this to create the first ticker tape.
Before the birth of the internet, traders would live close to exchanges like the NYSE to secure a healthy supply of ticker tape with the most up-to-date information. Thankfully, we’ve moved on a bit since then.
This post will examine the basic principles of day trading, and the rudimentary strategies traders can use to profitably trade various securities, including stocks, forex, and cryptocurrencies. We will also briefly explore some more advanced techniques traders use to trade these securities.
NOTE: You can get your free day trading strategies PDF below.
Day Trading for Beginners
Day trading typically refers to the practice of buying and selling a security within a single trading day.
While it is possible to day trade in almost any market, it is normally seen in forex and the stock market. In theory, day traders are well-educated and well-funded individuals working privately or as part of large financial institutions. However, with the birth of the internet and the online trading platforms that followed, it is now easier than ever for the average investor to begin day trading.
This practice is one of the most controversial topics in investing.
There is no shortage of prominent commentators who describe day trading as little more than gambling on the stock market. Many financial practitioners and economists vehemently argue that active trading strategies always underperform over long periods of time. Even Benjamin Graham, the renowned author of The Intelligent Investor, describes the practice as nothing more than high-risk, short-term speculation.
Day trading is certainly not for everyone, and it definitely carries a certain degree of risk.
The practice requires that those who engage in it are well versed in a multitude of strategies and have the psychological fortitude and discipline to focus and consistently apply their strategies throughout their trading careers.
While day trading is not for everyone, every single day across the world, traders profitably trade a wide range of securities in a large number of markets by implementing various strategies in a focused and disciplined manner.
Let’s look at some of the strategies that these traders employ to make profitably trading the markets a reality.
NOTE: You can get the best free charts and broker for these strategies here.
What are the Different Day Trading Strategies?
When analyzing a stock and determining a strategy, there are generally two methodologies that traders can employ: technical or fundamental.
Technical analysts use price charts and a series of indicators to predict the price movements of a particular security. This is in direct contrast to fundamental analysts who determine the strength of a company by examining the financial health of its sales, revenue, and profits.
When choosing a stock to trade or a strategy to use, most traders favor and implement only one of these two methodologies. However, some day traders have found great success by integrating fundamental analysis tools with those of technical analysis.
History has proven that a technical strategy has always outshined economic and fundamental analysis in the short term.
Why then would traders want to incorporate fundamental analysis into their decision-making? It is largely because most of the investing public uses fundamental analysis.
As soon as many people believe in the value of fundamental analysis and begin to make trades based on those beliefs, the experienced day trader will want to take advantage of that situation. This day trader may select a stock because of its fundamentals but determine his entry and exit points based on the technicals.
Whilst most day trading strategies will rely on technicals, that does not mean that fundamental analysis should be ignored entirely. Below are some of the most common day trading strategies for both technical traders and fundamentalists.
Technical Analysis Strategies
Scalping
This strategy is prevalent in the forex markets that we will discuss in more detail below.
Scalping looks to capitalize on minute price changes in the price of a security. To operate this strategy, traders open a position on a security that is moving up in price and then close the position shortly after it becomes profitable. Alternatively, scalpers could seek to make profits by shorting securities trending down in price in the same way.
Traders who use a scalping methodology in their trading must also implement rigorous exit strategies to avoid significant losses.
One of the main benefits of this strategy is that it limits the trader’s exposure to risk.
Since the scalping trader will have a stringent exit strategy and will close trades as soon as they become profitable, the chances of significant losses are almost entirely diminished.
Another benefit of scalping is that traders need to know next to nothing about the security fundamentals to scalp it effectively. This makes it a very efficient strategy as the time cost of implementing it is nominal.
However, this strategy is not without risk and requires that a trader have a stringent exit policy for their trading as one large loss could effectively eliminate all the profits a trader has earned.
Since this strategy is inherently designed to make small profits from a larger number of trades, the trader employing a scalping method in his trading must also have the stamina to enter and exit from a large number of positions daily to make sufficient profits from this strategy.
Breakout Trading
Securities typically move between what traders call support and resistance lines. Resistance lines indicate the maximum price that a security has been trading for before it begins to fall in price.
When a security moves beyond this resistance line, it is referred to as a breakout.
This trading technique seeks to locate areas or levels that a security has been unable to move beyond and then waits for it to move beyond those levels. It is based on the premise that a stock will continue to move up once it breaks through that resistance level.
Here is an example of a breakout pattern on Shopify.

As with any strategy, breakout trading has its limitations.
As you can imagine, breakouts do not occur regularly, which means there will be limited opportunities to take advantage of this technique. Even when breakouts do occur, they are not always successful.
Oftentimes the stock will only momentarily break out before dipping back down. To successfully trade breakouts, a trader would need to closely monitor a large number of stocks to pinpoint the right opportunities. Breakouts often happen quickly, and so if a trader is not focused, they could miss their opportunity.
Traders also need to have the discipline to quickly close trades if it appears the breakout will not be successful and have the psychological framework to hold onto positions that are successful in making money over time.
Momentum Trading
Momentum investing is made possible because of the market’s volatile nature. It seeks to take advantage of volatility by opening short-term positions in securities trending up and then closing these positions once the stock shows any sign of moving down.
This strategy is prevalent in forex, stocks, and other assets to take advantage of strong price trends.
This investing strategy requires that traders have a relatively strong understanding of technical analysis.
When momentum trading, traders should generally keep an eye on the volume and volatility of the security. A Trader should also be mindful of their timing when entering a momentum position.
Useful indicators for this strategy will be the securities RSI and Moving Averages. Momentum trading is generally designed for short-term trades, although some momentum stocks can remain profitable trades for months, as the markets have recently seen.
The end of 2020 and the beginning of 2021 proved to be some of the most exciting times for momentum traders in the last 10 years.
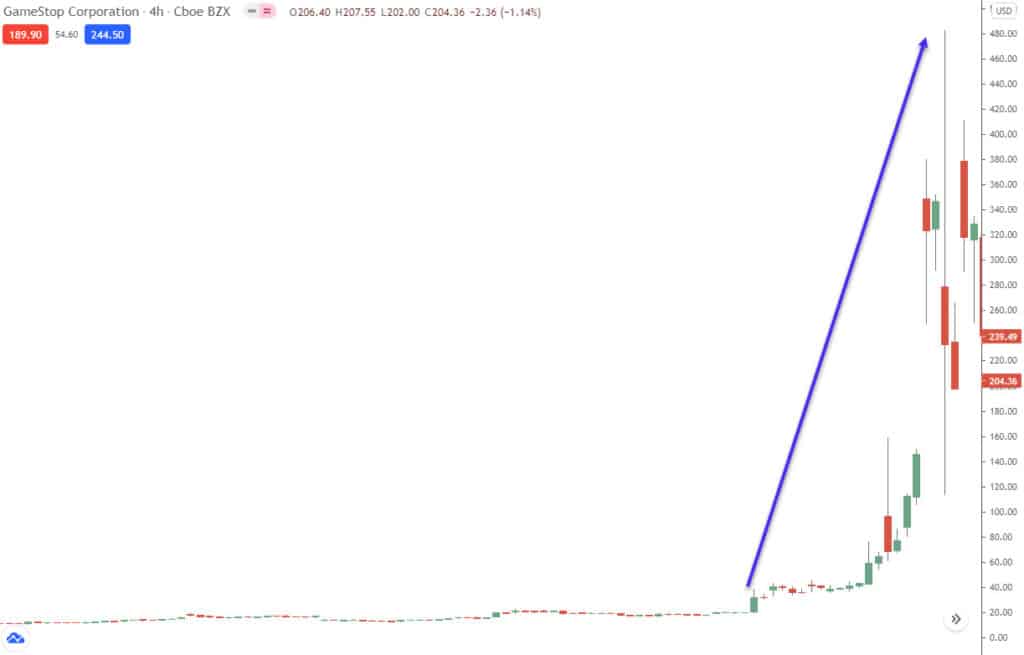
Due to external market factors, stocks like AMC and Game Stop (GME) were some of the most profitable momentum plays in the last 10 years. Unbelievably, Game Stop rose from a share price of $4 per share in August 2020 to a high of $347.51 in January 2021. That represents more than an 80x return for investors who entered the trade early and held on for the following 5 months.
See the Game Stop example below.
Reversal Trading
Everything that goes up must come down.
Reversal trading techniques are based on the presumption that after a significant rise in a securities price, the price of that security will reverse down and consolidate at a lower level. At the end of a trend, traders will notice that the volume of a stock will decrease, and the range it trades in will tighten heavily. This process may look similar to the stock chart pictured below.

Traders seeking to profit from a reversal need to exercise caution when doing so.
Determining when a trend has lost its steam due to a reversal is not always a straightforward endeavor. The Game Stop saga illustrates this perfectly. Even the most senior traders could have fallen into the trap of believing that GameStop was grossly overvalued at $200 per share, and the share price was in no way reflected in the company’s fundamentals. They may well have opened short positions expecting, understandably so, that the stock would reverse in price as the momentum died down.
This would have been a very costly mistake as the price continued to rise another 64% and would have caused traders who entered short positions significant losses.
When attempting to locate a stock candidate for a reversal strategy, it is recommended that the trader identifies a stock with the following characteristics:
- Hitting new highs or new lows;
- 5-10 consecutive candlesticks of the same color;
- RSI below 10 or above 90 would indicate extreme conditions.
Below we can see an example of a reversal in Tesla’s (TSLA) stock price. On February 2nd, it fell from $872.79 per share to a low of $563 per share on March 8th.

Fundamental Analysis
As we noted above, most day traders will rely on technical analysis-based strategies to day trade. However, it is entirely possible to day trade stocks based on the fundamentals.
Here are three of the most common fundamental strategies for day trading.
Earnings
The governing regulations require Stocks trading on public exchanges of their jurisdiction to publish their earnings every quarter.
These earnings reports will detail the company’s sales, revenue, growth, and other metrics relevant to the company’s overall financial health.
Trading on earnings is a fairly simple principle. If it is estimated that a company has performed well over the quarter for which earnings are being released, traders may conclude that, as a result of the positive earnings report, the stock price will rise to reflect the increased value of the company.
For example, if Chinese car manufacturer Nio outperforms estimates on car sales for the 2nd quarter of 2021 and therefore has an increased number of sales, it stands to reason that the share price will increase to reflect the increase in the company’s sales.
As with all trading strategies, trading on earnings carries risk. A trader may believe that a company will beat its earnings estimates and perform well. However, these estimates are not always accurate. Since earnings reports are typically released after the market has closed, a trader may open a trade believing a strong earnings report is forthcoming and find that the report was not as strong as anticipated and the stock has fallen in after-hours trading.
Even if the earnings report is as strong as the trader anticipated it would be, it sadly does not guarantee that its performance will reflect this. As is always the case, traders need to be aware of the wider market factors that could influence the price of a stock.
Etsy is a great example of this. Etsy’s last earnings report was released on 05/05/21. It noted that Etsy had enjoyed “exceptional first-quarter performance with gross merchandise sales (GMS) soaring 132% to $3.1 billion”. These results marginally outperformed Wall Street’s estimates and outlined that the company was in sound financial health.
This earnings report would have yielded a comfortable gain in Etsy’s share price on a typical day. Unfortunately, at the time of the release, there was a wider market rotation out of tech stocks with a high P/E ratio taking place. As a result, Etsy’s share price continued to fall from 184.57 on May 5th to a low of 157.68 on May 6th.

A trader seeking to trade off a positive earnings report in this situation would have sustained a significant loss had they failed to take this wider market shift into account.
Changes in Regulation
Regulation changes are an important consideration that every trader needs to factor in when trading.
One important regulation to be considered, especially by those who trade in the tech sector, is interest rates.
In the United States, interest rates are set by various members of the Federal Reserve who serve on the Federal Open Market Committee.
The regulations determined by this committee have a significant effect on stocks. If interest rates are high and continue to rise, businesses and consumers will cut back on spending. As a result, investors will begin to sell their stocks, especially those with a high P/E ratio, to expect lower earnings in the future. However, if interest rates are kept low, the result on stocks will be the opposite as consumers continue to spend and businesses continue to reinvest profits. As a result, traders need to keep a watchful eye on interest rates.
Other factors include but are not limited to:
- Inflation;
- Legislation;
- Consumer Price Index Data;
- Dividend payment dates;
- Political elections;
- Referendums such as the one that led to Brexit;
- Regulations caused by global health emergencies such as the Covid-19 Pandemic.
Experienced traders will be able to use these changes in regulation to trade the markets effectively.
For example, in March 2020, the regulations brought forward due to the Covid-19 pandemic caused a significant drop in the S&P 500. This presented an incredible opportunity for traders to short the market and make significant gains.

News Reports
News reports can also have a significant effect on the price of a stock. On May 14th, 2021, the Washington Post published an article detailing that Tesla’s Autopilot system had been engaged during a crash in California. This article caused Tesla’s share price to fall from $589.74 to $563.46 by May 19th.
After an investigation, it was determined that Tesla’s Autopilot system had not been engaged, and Tesla was not at fault for the accident.
Tesla’s share price immediately jumped back up and continued to rise to a high of $630 per share by May 27th.
Traders can take advantage of these news reports to trade stocks. In the example of Tesla, it would have been a perfect opportunity to short the stock when the article was published and then purchased the stock once the investigation revealed that Tesla was not at fault.
Day Trading Stock Markets
This section will briefly examine moving average crossover and how we can use them for trading trending stocks.
Some trends are very short-lived, and others last for months; when trend trading, a trader needs to identify when to enter and exit a position.
A technical tool known as the moving average crossover can help traders determine when they should enter and exit from these trades.
A moving average crossover occurs when two different moving averages, for example, the 50-day and the 100-day moving average, cross each other. When this occurs, it is an indicator that the trend may be about to change, and traders should consider exiting their positions.
Traders should combine moving average crossover with other indicators such as volume, support/resistance levels, and RSI to help them determine whether a trend will continue or not.
Below we can see an example of a downtrend that took place shortly after two moving averages crossed over.

Day Trading Cryptocurrency
If you believe that day trading is gambling, this is the wild west of the financial landscape.
Swing trading strategies are the most straightforward way to trade in this market. The basic idea behind this strategy is to monitor a range of different cryptocurrencies to identify a correction in a trend and then catch the “swing” out of the correction and back into the trend.
A correction is when candles or price bars overlap. You will find that trending prices move quickly, but corrections will not.
Another useful tip for traders in this market is to look at the number of wallets vs. the number of active wallets and the current trading volume. By doing this, you can assign specific currencies specific values that will help traders make more informed decisions.
Day Trading Forex
Forex, short for foreign exchange, refers to the global forex markets. These markets are incomprehensibly large, with trillions being traded daily. Forex offers traders a wide range of benefits.
Since there is no central market, unlike stocks, forex can be traded around the clock. Also, since traders are trading currencies, they are offered a far higher degree of leverage than they would be when trading other securities.
Traders trading in these markets from Australia could receive up to 1:500 leverage, allowing them to bolster their profits (or their losses) significantly. That said, under current ESMA regulations, European retail traders would be capped at a leverage maximum of 1:30.
The costs of trading in forex are also relatively low compared with other markets. These low costs, coupled with the volume of trading (over $6.6 trillion per day), mean that traders are provided with the liquidity to make a wide range of trades.
Any effective forex trading strategy will need to focus on two key factors: volatility and liquidity. Illiquidity will result in the order failing to close at the ideal price, irrespective of how competent a trader is. As a result, traders will be limited to trading specific instruments at specific times.
Volatility is the size of market movements. Firm volatility for a trader will reduce instruments to the currency pairs, dependant on the sessions.
When day trading in the forex markets, intraday candlestick patterns are prevalent.
Using candlestick charts can help filter out a lot of unnecessary information, allowing traders to get a clear view of a trend. In particular, the Heiken-Ashi chart will assist traders in identifying trends and spotting reversals.
Advanced Techniques for Day Trading
Here we will examine two more advanced chart patterns; head and shoulders and the double top pattern.
The head and shoulders chart formation appears as a baseline with three peaks.
It is given the trading term head and shoulders because of the left and right shoulders with the head in the middle.
In technical analysis, this chart pattern predicts a bullish to a bearish trend reversal.
This chart pattern is believed to be one of the most reliable trend reversal patterns. However, it does have its limitations. Traders using this pattern will measure the distance or height to calculate an estimated profit target. Unfortunately, because the profit target is just an estimate, the price may fall short of that target or move well beyond it.
The double top is an extremely bearish reversal pattern that presents itself after an asset reaches a high price two times, one after another, with a moderate decline between the two highs. Once the asset falls through a support level that is equal to the low between the two prior highs, it is confirmed.

This pattern is complicated to spot because it is only confirmed once it breaks below that support line.
Traders should exercise caution before trading and ensure that they have not misinterpreted the chart. However, once you can confirm a double top, you can reliably predict a change in that securities price trend and begin trading accordingly.
Lastly on Day Trading
After reading through this post, the question on most people’s minds would be, “should I start day trading?”.
As we mentioned earlier in this post, day trading is not an easy thing to do successfully.
Anyone can lose money in the markets, but it takes a skilled trader to make profits over sustained periods of time consistently. Day trading is a challenge without a doubt, but that does not mean you should shy away from it.
If you aspire to make your living through day trading, you must be prepared to learn and develop your skills continuously.
Start small, focus on a handful of stocks instead of diving in headfirst and wearing yourself thin. Finally, remember to keep your emotions in check. Successfully trading is as much psychological as it is technical; discipline is key.
NOTE: You can get your free day trading strategies PDF below.

Dylan is both a trained lawyer and an experienced financial content writer from the United Kingdom . He specializes in writing about the US markets and has developed a keen interest in cryptocurrencies and decentralized finance.