With the creation of this vast global network of computers that we call “the internet” came the dawn of the digital age that changed the world.
Investing, like most other aspects of life, was revolutionized by the internet. It allowed people for the first time to access and deliver information almost instantly from the comfort of their own homes. This allowed for stock prices to be readily available at a moment’s notice; gone were the days of tracking your favorite stocks on page 9 of the newspaper.
Eventually, this new technology paved the way for the trading platforms that we use today.
In this post, we go through a TradingView tutorial that will show you how you can start using TradingView in your own stock trading.
NOTE: You can get your free TradingView tutorial PDF below.
What is TradingView?
TradingView is a cloud-based charting and social networking software designed with both novice and experienced investors in mind.
Its free account offers basic charting, research and, analysis information to its users.
At the time of writing, TradingView boasts a social network of 30 million users strong. These 30 million investors and traders can utilize TradingViews software to inform their investing and trading decisions and share their ideas with other platform users.
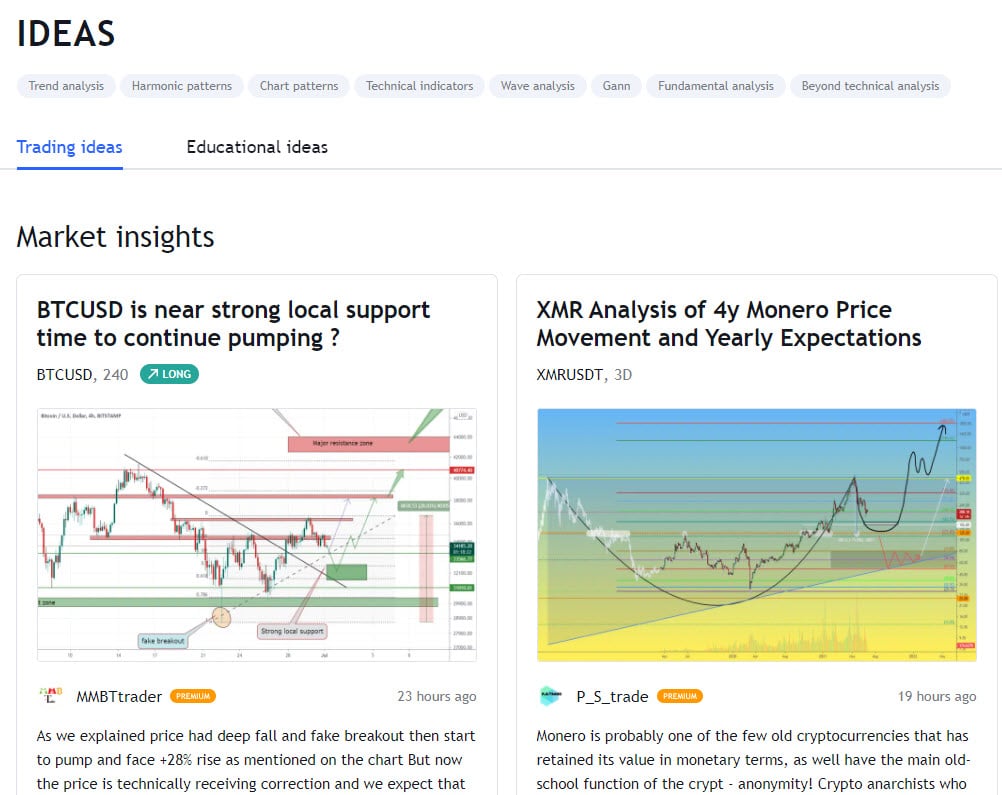
Traders can share their own charts with other traders and view other trader’s charts and analysis. This post will examine some of the advantages and disadvantages of using this software and some of the basic strategies users can employ to make use of their software successfully.
The Advantages of TradingView
Community
The human-animal is a social creature. Paleolithic man evolved in small tribes over thousands of years, and that need to be around other people is still a part of our genetic code today.
Trading the markets can be a very isolating activity. It involves long hours in front of a screen analyzing charts and data to make investment decisions. As a result, traders can often find themselves feeling rather lonely.
One of the benefits of using TradingView is that traders need not trade alone ever again.
The software allows traders to discover ideas, showcase their talents and interact with a large audience and active community of traders.
Professional Development
By interacting with others, traders can also improve their own trading skills as they can see what others are doing and listen to feedback or criticism on their own analysis. After all, trading the markets is very much an ongoing practice, and the best way to learn a skill is to mimic the actions of the best operators in your field.
If you want to learn to play basketball, you should probably watch Michael Jordan.
Features
The main benefits of using TradingView are found in the tools and software themselves. They offer some of the best HTML5 charts available intuitively designed for traders of every level.
Further, the software implements the Pine programming language, allowing traders to create their own custom studies and signals. This means that any custom indicator a trader could want can be easily created, and any study’s code can be easily modified.
TradingView also sends its users immediate notifications alerting them when the market has met their custom criteria.
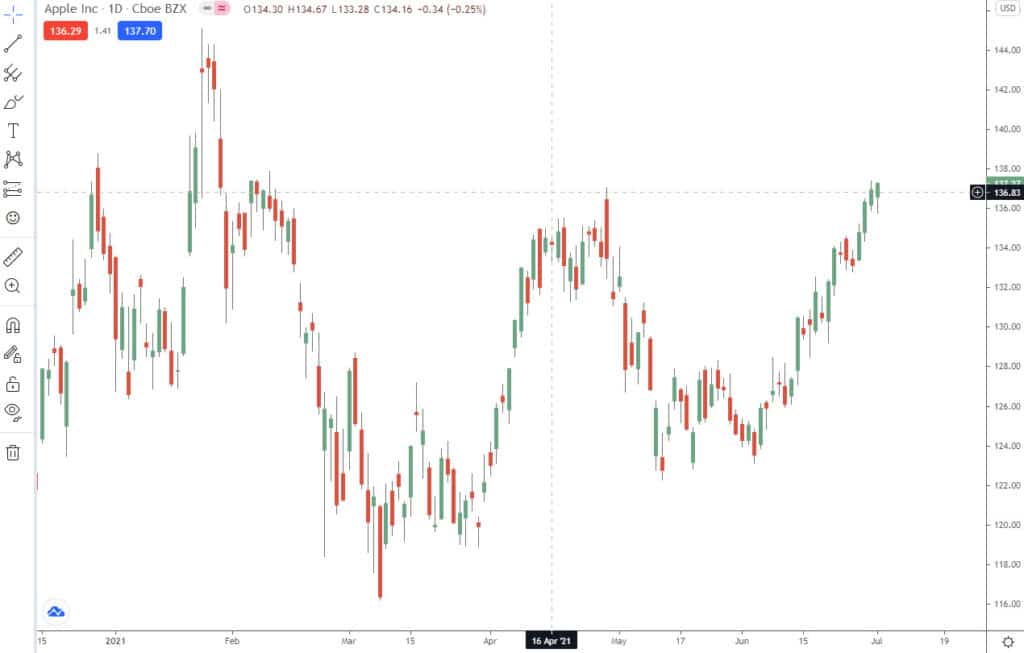
For example, a trader tracking Apple (APPL) waiting for the technicals to reach a certain level or the price to hit a particular target would be immediately notified when this occurred.
Finally, TradingView provides its users with real-time data and browser-based charts that allow traders to conduct their research anywhere since no installations or complex setups are required.
Traders need to open up TradingView on any browser and begin researching, charting, and sharing their ideas with access to many different markets.
Disadvantages of Trading View
As with all things in life, TradingView is not without its failings. TradingViews “chat” policies do not allow for profanity or insults, and offending traders will have their accounts banned or restricted.
However, TradingView has still not taken an active approach in removing traders who attempt to “troll” or promote penny stocks for their own self-interest. Similarly, with the development of cryptocurrencies, users on the platform attempt to scam other traders using the chat feature to request coins or promote their own fledgling crypto-related projects.
Further, some users have noted that TradingView’s customer service teams are slow to respond.
Some reports indicate that requests for assistance can take as long as 5 business days to be resolved. This can be an especially long wait for traders and, if you are experiencing an issue that is preventing you from trading, it can prove to be quite costly.
How to Use TradingView
Setting up and getting started with a Trading View account is a straightforward process.
Head to www.tradingview.com to register an account by selecting “sign-in” and then using Apple/Facebook/LinkedIn or your E-mail to register.
Once you’ve done that, you’re ready to begin. As noted earlier, TradingView has a large number of markets on its platform.
You can navigate to this by selecting the “markets” section on the top left-hand side of the screen.
Once you have selected a market and a stock, you can begin to use indicators.
To do this, select a stock, for example, Apple (APPL), and select the “Chart” function to open the chart for this stock.
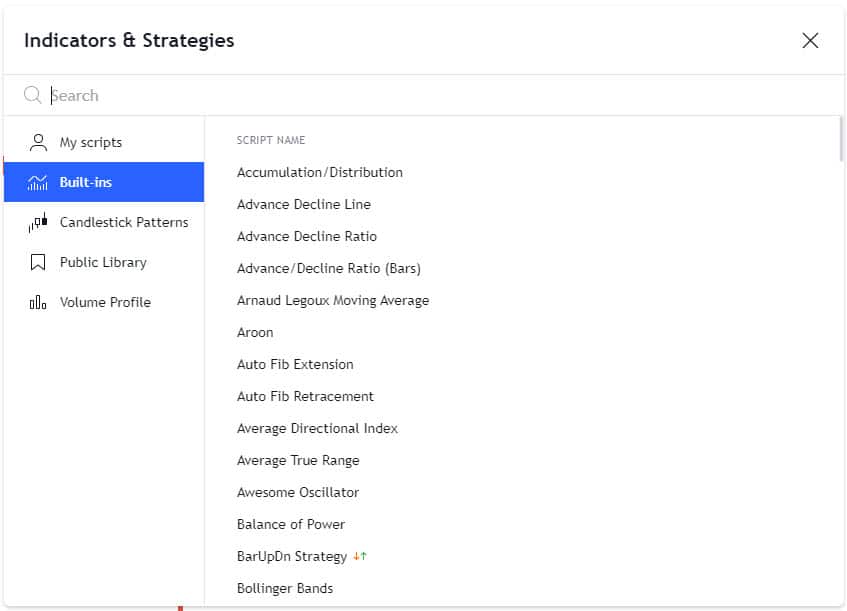
Once you have the chart open, you can find the indicators section in-between the “compare” and “financials” sections on the top left-hand side. There you will find several different indicators, including those built-in by TradingView and the “Public Library” indicators that were scripted and uploaded to TradingView by third parties.
Trading Strategies on TradingView
Pivot Point Strategy
One of the most widely used strategies traders utilize is known as the Pivot Point / Reversal Strategy.
This refers to taking bounce trades off of the Pivot Point. The Pivot Point indicates the direction that an asset may be heading in next.
Day traders often employ pivot Points, and they are denoted by using support and resistance levels that favor the trend an asset is moving in. In short, this strategy utilizes entry and exit protocols to determine optimal trade times and when a trader should take bounce trades.
Here are a few things to look for and rules to follow when employing this strategy in your trading;
- If the price of the equity starts trading above the Pivot Point, it is often recommended that traders open a position as close to the Pivot Point line as possible as it indicates that the equity is gaining strength and could begin to trend higher.
- When the market closes at X pips above the Pivot Point level, a trader would be well advised to open a trade if the market touches the Pivot Point line. However, this is only if the line is stable and reliable in its position and direction.
- Traders should employ a stop-loss order for a trade if it is a few pips below the Pivot Point. A stop-loss order below Support 1 (S1) provides a greater margin of error in the trade.
Momentum Strategy
This strategy was created to do just as the name implies.
It is a simple strategy designed for those interested in momentum trading and is predicated on the price movements of a stock over a period of time. That period of time is determined by the individual trader in the strategy settings of TradingView.
The trader enters long when the change over the period turns positive and the period’s change has risen. The trader enters short when the change over the period turns negative and the period’s change has fallen.
This strategy can be used on any stock and within any time frame the trader wishes. The trader in the strategy settings can edit the specifics of the trade.
Traders should remember that this strategy aims to work with volatility by locating buying opportunities in short-term uptrends and then closing their positions once that equity begins to lose its momentum.
Gauging a stock’s momentum is a difficult skill to master, and traders should be aware that this strategy carries risk as traders may either enter a position too late or exit from it too early.
Consecutive Up / Down Strategy
This strategy is largely focused on trend trading.
Traders can use this strategy over any time frame, and all the values can be edited in the strategy settings.
Using this strategy, a trader will enter long if, for at least X consecutive bars, the current close is greater than the previous close. The trader will enter short if Y consecutive bars the current close is lower than the previous close.
Greedy Strategy
The greedy strategy was designed to take advantage of gaps in either direction of the market.
The trader opens an initial order if there is a gap between the current open and the high or low of the previous bar. If the open is greater than the previous high, then the trader goes long. If the open is below the low of the previous bar, the trader opens a short position.
Once a position has been opened, it will continue to fill orders in the same direction, provided that the candle’s color is consistent with the open position. This will continue until either a different color candle presents itself or the trader reaches their limit of filled orders for the day.
This strategy has some obvious limitations in that the strategy can only work with one buy/one sell operation. It is unable to sell and buy at multiple time stamps.
Conclusion
Whether you are eager to learn about day trading or are simply curious about what is happening in the markets, TradingView appears to be an excellent resource for every level of investor.
The platform hosts several different tools that traders can use, including stock screeners, charting, and researching.
Many of these tools are available to users for free, but users can also interact and share ideas.
NOTE: You can get your free TradingView tutorial PDF below.

Dylan is both a trained lawyer and an experienced financial content writer from the United Kingdom . He specializes in writing about the US markets and has developed a keen interest in cryptocurrencies and decentralized finance.