Technical traders rely on various data points and indicators to identify trading opportunities in the markets and aid their decision-making whilst trading. This post will examine two specific candlestick chart patterns, the double top and double bottom patterns. We will look at both how to identify them and the strategies traders can employ to utilize these chart patterns effectively.
The double top and double bottom trading patterns are among the most common trading patterns traders will find. These patterns are so common that they serve as evidence against academics who believe that price movements in the market are wildly random. It is therefore prudent for traders of every level to be familiar with these chart patterns when trading.
This post will reference several found in technical analysis such as support and resistance levels, RSI, the parabolic SAR, and necklines. If you are unfamiliar with these terms, it is recommended you read about the important trading terminology you should know before reading on.
NOTE: You can get your free double top and double bottom pattern strategies PDF below.
What is the Double Top Pattern
The double top pattern is a bearish technical analysis reversal pattern.
This pattern is formed when a security reaches two consecutive highs with a slight decline between the two highs. The two peaks are formed above a support level known as a neckline. This pattern resembles the letter; M; you can see an example of a double top pattern in the chart below.
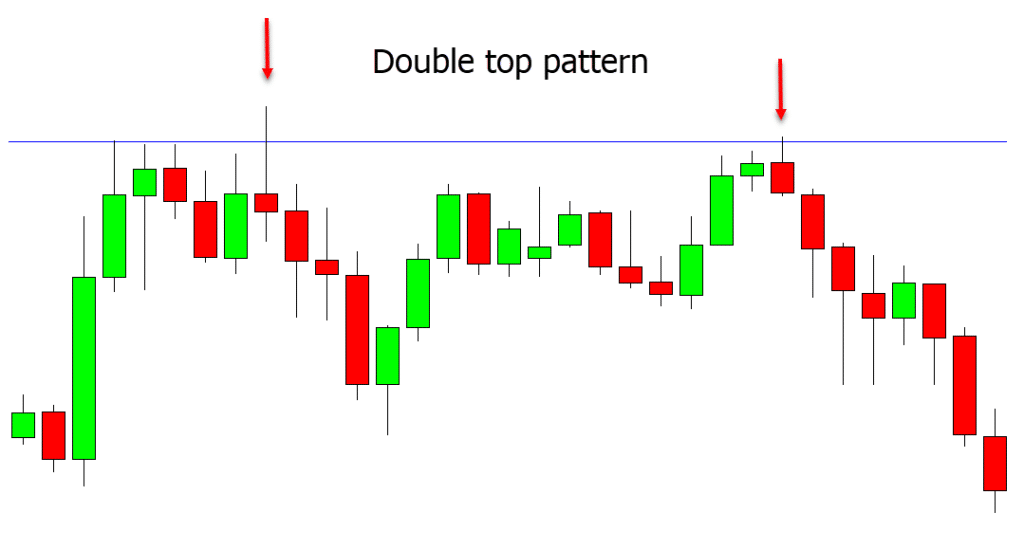
This chart pattern signals that a medium to long-term change in the security’s price is imminent, and the price of that security is likely to begin to fall.
What is the Double Bottom Pattern?
The double bottom pattern is a bullish technical reversal pattern.
This pattern is the opposite of a double top. It indicates that a potential uptrend in the price of a security is likely. This pattern is formed when a security experiences two consecutive lows with a slight increase between the lows. A resistance line will form in-between the two lows.
As with the double top pattern, this is also referred to as a neckline. The pattern resembles the letter W; you can see an example of a double bottom pattern in the chart below.

This chart pattern signals that a medium to long-term change in the security’s price is imminent, and the price of that security is likely to begin to rise.
. NOTE: You can get the best free charts and broker for these strategies here.
How to Identify the Double Top and Double Pattern
To understand how to identify these patterns, traders first need to understand why they work in the first place.
It is widely accepted among technical analysts that technical trading is largely an effect of wider market psychology. Traders recognize patterns in large numbers and adjust their trades accordingly. When large numbers of traders are trading on the same data, technical analysis largely becomes a self-fulfilling prophecy.
Traders should be aware that these trading patterns typically form over long periods of time.
The patterns do not always clearly resemble the letters M and W, nor do the highs and lows need to reach the same points for the M or W pattern to have formed. Identifying these patterns can therefore be quite challenging.
To correctly identify a double top or double bottom pattern, a trader must look for the following:
- Identify a general market trend. Since these two patterns indicate a trend reversal, then the first step for a trader will be to identify a trend that could reverse. If the market is trending up, traders will be looking out for a double top, as the market could reverse into a downtrend. If the market is trending down, then traders will be looking out for a double bottom, as the market could reverse into an uptrend.
- Identify a top or bottom. To be a double top/bottom, it is logical that there must be a first top or bottom. Follow the general market trend until a clear top or bottom presents itself.
- Find the neckline. The neckline will be a manually drawn line in between the two tops or the two bottoms. In double bottoms, this will be a resistance line. In double tops, this will be a support line. This line will help you to confirm the double top or double bottom and trade it effectively.
- Neckline breakout. Once the price of the security moves beyond the neckline, the double top or double bottom has been confirmed. The trader can then reliably assume that the trend has reversed. At this point, a trader can trade the double top/bottom with a high probability of success.
False Double Top and Bottom Patterns
As a powerful reversal pattern, traders are always on the lookout for double tops/bottoms. However, there are times when these patterns can be a double-edged sword.
The price movements on these patterns can often give the impression that a double top or bottom is forming, only for the support or resistance lines to be broken and the pattern to fail.
A false double bottom/top refers to a situation where one pattern is forming, but it does not bounce off the resistance/support lines (necklines). This would indicate that the pattern is not genuine, and the trend may not reverse.
Thankfully, one important metric a trader can consider is distinguishing between a genuine double top/bottom and a false one.
A trader should examine the time frame between the two tops or bottoms.
The longer it takes for the two to appear, the higher the probability of being a false pattern. The shorter the time between the two bottoms/tops, the higher the probability it is genuine.
The uncertainty of double top and bottom patterns forming is one reason why trading these patterns can be particularly challenging. Let’s now examine how we can trade double tops/bottoms.
How to Trade the Double Top and Double Bottom Patterns
There is no magic formula for any trading pattern. No generalized metric or indicator can tell traders how to trade a specific pattern correctly every single time.
If traders could make predictions that accurately, the number of billionaires on Earth would increase rapidly. Every trade, every security, and every moment will be slightly different.
Ultimately, it will be up to the subjective intuition of the individual traders’ experience to determine how best to execute a trade.
Generally, there are two ways to profit from these patterns. Traders can either open a short position on a double top or a long position on a double bottom. Before either of these actions is taken, the trader should confirm the patterns with other technical indicators such as the RSI or the parabolic SAR.

Both of these are momentum indicators, so they will be instrumental in determining the trend reversal indicated by these two chart patterns.
Traders can use either ‘Contracts for Difference’ (CFDs) or spread betting during both a double top or a double bottom pattern.
During a double top pattern, the trader could use either CFDs or spread betting to open a short position after the second peak of the double top. With a double bottom, traders can use the same instruments to open a long position after the second bottom.
Reactive/Predictive
As we know, these patterns are established when the neckline resistance/support level is confirmed.
There are two ways traders can approach these situations. Traders can attempt to predict that the pattern will be confirmed or react to it once it has been. Both of these methodologies have their strengths and limitations. Which methodology you pick will be largely determined by your psychology and the type of trader you are.
Traders with a fader mentality, selling into strength and buying weakness, will try to anticipate the pattern by stepping in front of the price movement.
Reactive traders will want to see that the pattern exists and has been confirmed before entering into the trade.
Those traders who take the predictive approach will make larger gains and incur more risk as they do so.
Reactive traders must pay worse prices to enter the trade and stand to make less profit from their positions. That said, their risk level is considerably lower as the pattern has been confirmed by the time they enter into the position.
Stop Loss
Another issue for traders who are trading these patterns will be where they should place their stop losses.
Conventional wisdom would dictate that traders should enter their stop losses either at the top of the double top or the bottom of a double bottom. However, trading the markets is rarely straightforward, and conventional wisdom usually falls short.
Since these patterns are as common as they are, they are regularly targeted by retail traders.
Institutions trading the markets are well aware of this and are more than happy to exploit retail trading psychology to their benefit. Their trading strategy will be to buy shares in large enough volume to manipulate the price in the direction they want. This will force weaker retail hands to exit their trades shortly before the price changes direction again. This can lead to a great deal of frustration for retail traders who exited a profitable trade with a loss.
It is therefore advised that traders exercise caution when implementing their stop losses when trading these patterns.
Lastly
Double tops and double bottoms are two of the most prevalent trading reversal patterns.
While these patterns can be extremely reliable for traders to base their trades on, this is not always the case. This is why traders always need to look at other technical and fundamental metrics before making their decisions.
No one indicator or pattern is reliable 100% of the time. The best traders incorporate a wide variety of different data points and indicators into their decision-making.
Lastly, when studying charting patterns, it should be noted that it is easy to look over them in hindsight and detail exactly when you entered and exited a trade.
Doing this in real-time, with the risk of losing real money, is an entirely different animal.
Individuals learning to trade should not begin trading with large amounts of money until they have sufficient experience in trading with smaller amounts.
NOTE: You can get your free double top and double bottom pattern strategies PDF below.

Dylan is both a trained lawyer and an experienced financial content writer from the United Kingdom . He specializes in writing about the US markets and has developed a keen interest in cryptocurrencies and decentralized finance.