Every day across the world, traders log into their brokerage accounts to trade securities on the financial markets in the hopes of making a profit. To do this, traders rely on several techniques and strategies designed to take advantage of opportunities in the market. These techniques and strategies can be based on either technical or fundamental analysis.
This post will focus on a specific technical trading strategy that relies on what is commonly referred to as support and resistance levels. We will examine what these are, how you can locate them, and the strategies that can be employed to trade using these technical indicators profitably.
NOTE: You can get your free support and resistance trading strategy PDF below.
What is Support and Resistance?
This question is arguably one of the most discussed topics of technical analysis.
Whilst the basic concept of support and resistance is a fairly elementary concept to grasp, it becomes far more challenging to master when traders understand that support and resistance lines come in various levels. Let’s look at the basics of support and resistance.
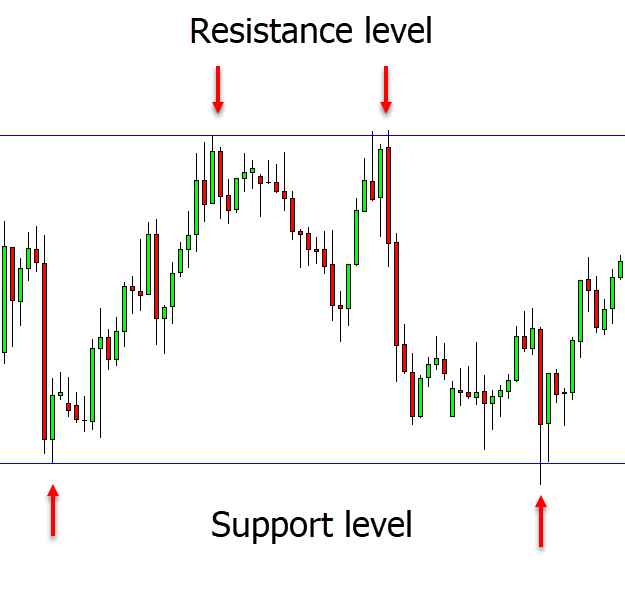
A support level is where a stock will cease falling in price. During a downtrend, stocks will continue to decrease in price. Eventually, these stocks will hit a “floor” beyond which the price seems reluctant to fall. This floor is described as a support level. Resistance levels are the opposite. During an uptrend, stocks will continue to rise in price.
Eventually, these stocks will hit a “ceiling” beyond which the price seems reluctant to rise. This floor is described as a resistance level.
Generally speaking, stocks will trade in between these support and resistance levels. Prices will fluctuate between the two, bouncing off the support line when the price falls too low or off the resistance line when the price gets too high.
At this point, you may be wondering what forces dictate these levels of support and resistance? Are they arbitrary, or is there a reason why support and resistance levels develop? The psychology behind support and resistance levels is a fascinating topic. In any given financial market, there generally tend to be three types of participants;
- Those who are long and are waiting for the price to rise.
- Those who are short and are waiting for the price to fall.
- Those who have not yet decided and wait on the sidelines for a better entry point.
The terms fear, greed, and herd instinct are all terms that are regularly referenced when discussing human behaviour in financial markets.
It is important to consider human behaviour when trying to understand support and resistance levels because this is an important factor influencing the price actions that we can observe in the markets. Therefore, we can view chart patterns as visual representations of the optimism and pessimism being experienced by the three types of participants mentioned above.
For example, fear and greed can be seen when the price falls back to a support level. The traders who are already long will add to their positions to increase their long-term profits. Meanwhile, the short traders will buy to cover their positions out of fear of losing money.
Herd instinct is observable as traders tend to congregate around these levels, further strengthening them as a result. Support and resistance levels are, therefore, the result of large amounts of traders congregating around the same levels.
Therefore, support and resistance levels result from market psychology, human behaviour, and wider market forces like supply and demand. Traders will then use these levels to plan both their entry and exit points for trades.
NOTE: You can get the best free charts and broker for these strategies here.
Support and Resistance Zones
Since support and resistance levels are formed by large amounts of traders congregating around similar price points, it is very unusual for the price to hit the same level time after time before reversing. As a result, we refer to these as zones because they are the general area around which support and resistance can be found.
Support and resistance zones are key when determining the price area that a security will move in. The trouble is, these zones are very subjective, and in most cases, traders can only approximate where these levels may be.
What may be interpreted by traders as a support or resistance level may result from chaotic market fluctuations. This can lead to a great deal of difficulty for traders attempting to use these levels to time their entry and exit points.
Since technical traders basically utilise these zones to study past price movements and predict future ones, several tools are available to traders to help locate them.
Traders can draw these zones using simple tools used in technical analysis, such as horizontal lines. They can also employ the use of more sophisticated indicators like Fibonacci retracements. We will discuss these tools and indicators in more depth further below.
Outside of these tools and indicators, how do traders effectively identify support and resistance levels?
How to Find Support and Resistance Levels
As we have mentioned earlier, distinguishing between random price fluctuations in the market and genuine support and resistance levels can be challenging. However, there are several methodologies that traders can implement to do this.
The first is to identify the highs and lows in the price levels of a security’s price chart using its historical price data.

The basic premise of this method is that, once the highs and lows have been identified, traders can track how many times the price of the security tests them. In science, to test a hypothesis, one must experiment. If the results of that experiment are repeatable and consistent, then one can reasonably conclude that the result is reliable.
Assume that a trader believes that a stock is range-bound with resistance at $20 and support at $10. The best way to test this hypothesis is to examine the chart. How many times does the stock hit these support and resistance levels and bounce off them? The more times a stock falls to support and rises or rises to resistance and falls, the more reliable the conclusion that there is support and resistance at these levels.
However, whilst this may be the conventional wisdom, it should be noted that conventional wisdom is seldom wise in the financial markets, and traders should always exercise caution and use other metrics to confirm their conclusions.
For example, traders can find support and resistance levels through the use of moving averages, or pivot points. To use these indicators, traders should draw a diagonal line from the highest peak to the lowest peak to identify which way the trend is moving. If the trend line moves up, the moving average will act as a support line and vice versa.
Traders refer to this as dynamic support and resistance, as the levels are constantly changing.
How to Identify Strong Support and Resistance Levels
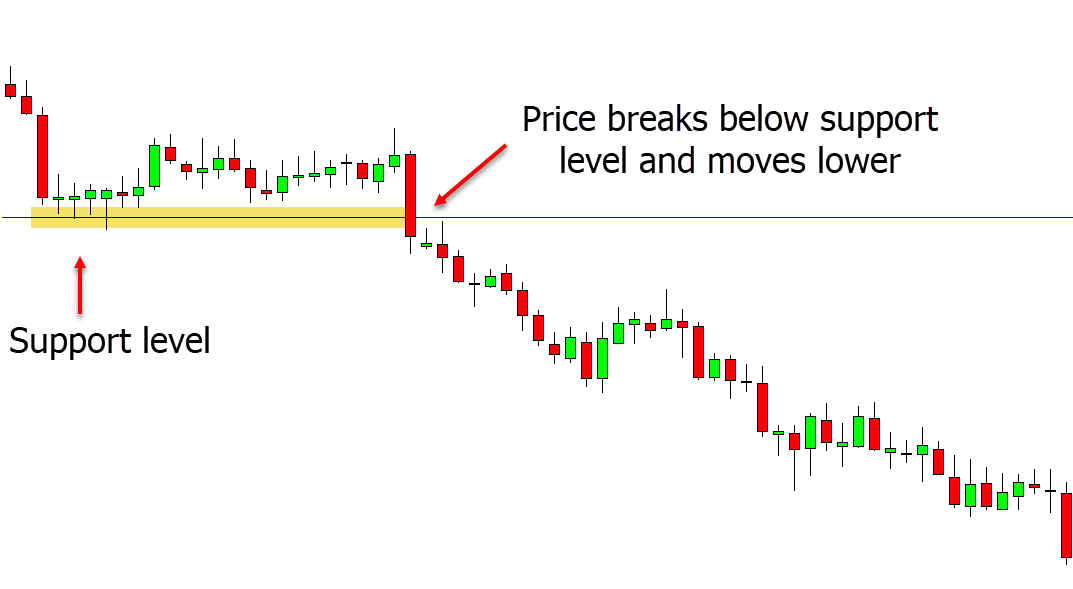
Occasionally, the price of a security will fall below its support levels. When this occurs, buyers may be delighted that the price has dipped below its support level and quickly purchase as many shares as they can. This will inevitably drive the price back up to its previous trading range and is known as a Wyckoff Spring.
The opposite is also true. If the price of a security rises well above its resistance levels, what is known as a Wyckoff Upthrust may occur, and traders may reject a price increase, causing the price to fall back down.
One of the best ways to identify a strong support or resistance level is for traders to keep an eye out for these Wyckoff movements. These are important clues for traders and well worth paying attention to.
Wyckoff movements tell traders that there is either a lot of buying pressure or selling pressure at support or resistance levels. They serve as one of the best ways to confirm that these support and resistance levels are genuine and not simply random price fluctuations.
Traders should note that when a stock is trending, identifying strong support or resistance levels can be especially difficult as the levels themselves become dynamic.
As a general rule, previous resistance levels will serve as support when a security is trending upward. Similarly, when a stock is trending downward, previous support levels will become new resistance levels.
That said, every trader should always remember that however strong a support or resistance level may be, there is no guarantee that the market will respect it, and the price may fall below or rise above them for any number of reasons.
For example, when the World Health Organisation declared Covid-19 a pandemic, stocks in the US markets began a month-long decline in price, and day after day, the market saw support level after support level being shattered.
How to Trade Support and Resistance
Support and resistance level trading strategies are some of the most rudimentary and fundamental trading strategies traders can employ in their trading. They can be used to assist traders in managing their risk, determine market conditions, and pinpoint appropriate entry and exit points.
When using these levels, the most basic trading strategy is for traders to buy a security when it is approaching a support level and then sell when it is reaching its resistance level.

Alternatively, traders could short a stock when it reaches its resistance level and close their short positions once the security retraces back towards its support level.
When using this particular strategy, traders should wait for confirmation that the market is still following this trend. To do this, traders may use a range of other indicators such as the Relative Strength Index (RSI) or moving averages.
Another strategy traders could implement is known as the “breakout” strategy. This strategy involves traders waiting for the price of the security to move outside of either its support or resistance levels. It is based on the premise that when a security moves beyond its support or resistance levels, the security may continue to move in that direction long enough for traders to profit from the price fluctuations.
When using this strategy, traders should use several technical indicators to verify that the breakout is genuine. Volume is a particular indicator that traders should pay attention to when using a breakout strategy. For a breakout to be successful, there will need to be many shares being traded. A breakout with a low volume is unlikely to succeed.
Traders employing a breakout strategy should remain cautious for various reasons.
High volume in a potential breakout does not always mean the breakout is genuine. Even if there is high volume in a trade, it is common for a security’s price to retrace back down to the breakout point before breaking out again. This is caused by short-term traders rapidly trading the breakout and selling for a quick profit.
One recommendation for those trading support and resistance levels is that traders place their stop losses below support or above resistance. This will help close the trade quickly if the price of the security goes through a breakout. Before entering the trade, traders should identify both their profit targets and the level of loss they would be willing to accept if the trade does not go as anticipated.
Support and Resistance Breakouts
A breakout refers to when the price of a security moves either beyond a resistance level or below a support level.
However, a breakout is not merely a slight movement beyond a security’s support or resistance levels; they are defined as sudden and relatively rapid price moves beyond these levels with an increase in momentum. These breakouts provide traders with opportunities to employ the breakout strategy mentioned above to profit from these price movements.
There are several factors, both fundamental and technical, that could lead to a breakout. Earnings reports are a fantastic example of a fundamental event that may cause a breakout in the price of a stock. If the earnings report is glowing, the price of that stock may smash through prior resistance levels.
Whereas if it is terrible and highlights the company as being in poor financial health, its price may plummet through various support levels.
One technical catalyst that may cause a break-out is stop-losses. Traders may collectively place stop losses at certain points above or below support or resistance levels. As we know, these levels are not always exact, and the price of a security may fluctuate around these levels.
If the price fluctuates a little more than may have been anticipated, it may trigger stop losses of untold numbers of traders who then automatically close their positions. This mass closing of positions forces the price of that security further down/up and leads to a spike in the volume, which then confirms the breakout is occurring to other traders, which leads to an even stronger breakout in the price of that security.
Support and Resistance Indicator
Technical analysts have developed a wide range of indicators to help support traders in the financial markets. When trading using a support and resistance strategy, there is one tool, in particular, that is especially useful.
The Fibonacci retracement tool is one of the most popular tools because it helps traders identify support and resistance levels more clearly. This tool is handy because it can be drawn between any two significant price points. The indicator will then create the levels of support and resistance between those two points.
Like almost all things in technical analysis, the Fibonacci retracement tool is largely a product of market psychology. This tool is based on the Fibonacci numbers, which are extremely common in nature. This leads trades to assume that they will also be common in the financial markets. As a result of this collective belief, the Fibonacci retracement tool has proven to be a highly effective way of gauging support and resistance levels.
Beyond the Fibonacci retracement tool, there is also a range of custom indicators available to traders on various charting platforms like TradingView and MetaTrader.
For example, Support and Resistance (Barry) is a simple indicator available on TradingView. This indicator displays dotted lines along with the recent high and low points. These lines extend out to the right until another new high or low is formed so traders can easily observe the support and resistance levels for the security.
To apply this indicator, traders need to go to tradingview.com and select “chart”. Once a security has been selected, the chart for that security will appear. To apply the indicator, you need to then select “indicators” and search for “Support and Resistance (Barry)”. Once selected, the indicator should be automatically applied to the chart.
Lastly
If there were only one universal truth in trading, it would be that no strategy works all the time. However sophisticated, technical or ingenuous a trader may believe his strategy to be, it will invariably fail at some point. In trading, a trader should try to be right more often than he is wrong.
Trading support and resistance levels are no exception to this universal truth.
While it is one of the most common ways to trade and perhaps one of the simplest trading concepts to understand, it also has its limitations. Its main weakness lies in the subjective nature of support and resistance levels themselves.
Since there is no specific price point at which a support or resistance level can be found, it is up to the intuition and experience of the individual trader to identify these points for themselves.
Whatever strategy a trader uses, proper risk management is one of the most important aspects of successful trading.
Traders should ensure to calculate the amount they are willing to lose on a trade and set a strict stop loss to ensure that their losses are limited if the trade does not go as planned.
NOTE: You can get your free support and resistance trading strategy PDF below.

Dylan is both a trained lawyer and an experienced financial content writer from the United Kingdom . He specializes in writing about the US markets and has developed a keen interest in cryptocurrencies and decentralized finance.