Irrespective of the instrument you choose to trade, whether stocks, options, or currencies, every second in the market presents a trading opportunity. This means two things; that you should never beat yourself up for missing out on a trading opportunity because there will always be others, and that you need to think long and carefully before executing a trade.
As you become more and more experienced with trading, you’ll get better at spotting trading opportunities.
That is both a good thing and a bad thing. As you can spot lots of trading opportunities easily, you’ll run into the biggest problem any trader can face; too many ideas and not enough capital.
At this stage, it becomes crucial for you to choose and pick opportunities that are more likely to make you money and reject those that won’t. This comes down to having profitable trading setups that maximize the chance of profitability.
In this post, you will find out what high probability trading setups are, some of the best trading setups and chart patterns, and how you can trade profitably.
NOTE: You can get your free high probability trading setups PDF below.
What are Trading Setups?
Before identifying profitable trading setups, the first step is for you to understand exactly what trading setups are.
A trading setup is the basic set of conditions that need to be met before deciding that a particular opportunity is worth trading on. It is different from a simple chart pattern because identifying a chart pattern is merely one of the various requirements that need to be met.
For example, if you are a trend-following trader, then your trading setup would involve, at the very least, a trend.
No matter how many candlestick patterns you see, you will not enter a trade until it conforms to your particular trading setup. Every trader has their own trading setup, which they build up over time through experience and make both good and bad trades. As a beginner, the ideal for you to go about would be to choose someone else’s successful trading setup and then gradually tweak it to your own preferences.
NOTE: You can get the best free charts and broker for these strategies here.
What Are High Probability Trading Setups?
There are several types of trading setups that a trader might use in their day-to-day trading. However, the best and most sought-after type of trading pattern are high probability trading patterns.
These are patterns and setups that, once identified, have a high probability of succeeding.
Every trader aims to discover and exploit high-probability trading setups to make money; however, this is not always easy and involves having a set system that you follow every day.
The price of a particular security in the market is the total of the impacts of every single bit of information available to the market at that given instant. This keeps changing every second, which is why stock market prices are in a state of constant change. This is why every second offers a new setup and a new trading opportunity. As mentioned earlier, a good trader must identify and separate high-probability trading setups so they can avoid spending money and time on the low-probability opportunities and instead maximize their profits.
Coming across high-probability setups is not easy and requires an enormous degree of patience. The basic criteria that enable traders to identify high-probability trading setups have been given below.
Identifying Decision Spots and Triggers
Most high-probability trading setups revolve around trading on the support and resistance model. How these levels are determined can differ from setup to setup; however, one thing remains constant across all these models: it is only at these levels that the probability of a profit is the highest.
At the other levels, there is only a low chance of the trade being profitable. These levels are important, as they represent decision spots: these are the price levels at which the trader has to decide whether or not the price movement is reliable enough to open or close a trade. Identifying the right decision spots is a crucial step towards maximizing the chances of your profitability.
However, merely this is not enough. What a profitable trader also needs to do is look for triggers.
Triggers are actions that, upon their occurrence, indicate that the conditions are right for a trade to be opened. Put; they are signals of interest that the trader looks for when the price touches a decision spot. It can be thought of as a call to action and an indicator that the time is right to trade. These triggers determine whether a trader will be trading on the bounce or the breakout in support and resistance trading.
Confluence
As explained in earlier articles, there are various indicators that traders use to ensure that their signals are right and that they are not simply misinterpreting the data. Confluence is basically a situation where multiple indicators point towards the same outcome and can be used to increase the potential profitability of a particular trade.
The important thing to remember while using confluence to trade is that the indicators you use need to be different; otherwise, you will engage in confirmation bias.
For example, if you have already used the Simple Moving Average Indicator, you should not also use the Exponential Average or Weighted Average indicators, as these will not add to the value of your setup and will only serve to confuse you further.
Normally, traders tend to use several types of indicators to confirm their ideas and maximize the profitability of a trade. These indicators include an averages indicator, a volume indicator, as well as a momentum indicator.
However, the kind of indicators you use will depend entirely on your own preferences, which will be developed over the course of your experience as a trader.
Wide-open Space
The wide-open space in a trade is the difference between the decision spot where the trigger is achieved and the next decision spot, which would potentially represent an exit opportunity or a reversal in price direction. This is identified at a confluence level.
If there is only a little wide-open space in a particular trade, say the candlestick trend reversal is occurring only a short distance away from the designated resistance level, this would indicate that there are not many exit opportunities for the trader. Therefore, the profitability potential for this trade is also quite low.
If there is a lot of wide-open space, it indicates that the trader can make higher profits and that the trader can exit at any time in the space without worrying about a reversal in the direction of the trend.
Some of the Best Stock Market Patterns
There are several trading patterns that you, as a trader, will be on the lookout for to maximize your profits and ensure that you consistently make money on the stock market. However, the best trading patterns occur in a support and resistance level chart.
Before delving deeper into them, you need to understand what resistance and support levels are and what trading patterns can be spotted by using these levels.
Support and Resistance
Support and resistance are two price levels that represent decision levels, as these are the price levels at which the price is most likely to reverse the trend.
The support is the lower level of the price movement, at which the price normally changes from a downtrend to an uptrend and is usually considered a good place to go long in case you can see the support levels holding.

Similarly, the resistance levels represent the upper limit, where the price will change from an uptrend to a downtrend, making it a good location to short the price if the levels are holding.
Of course, these levels might not always hold, and occasionally, the price might break through these levels and continue on the same trend. When this happens, that is also an indicator: this indicates that the same trend is likely to continue for a while, representing a good opportunity to ride the trend.
There are several ways in which the support and resistance levels can be determined.
One of the simpler ways is to look at the price movement over a long time and see what the resistance and support levels have historically been.
For example, if you look at and trade on 5-minute candles, your support and resistance levels will be determined by the price movements over the past 2 months. For traders with a longer timeline, the history of the price action that they have to look at gets longer accordingly.
The other way for traders to calculate these levels is through the use of pivot points. These can be calculated using the price movements of the previous day and yield several decision spots that are unique to a given day. Hence, they represent exclusive, high probability trading setups that traders often use to their advantage. You can find our article on trading using pivot points here.
Trading Support and Resistance Levels
Once you have identified the right support and resistance levels for a stock based on your criteria, there are 3 main patterns that you can trade on. These are a pullback, breakout, and failure test. Each of these has been discussed below.
Pullback
A pullback occurs when the support and resistance levels hold, and the trend reverses at these levels.
This means that if the price was previously in an uptrend, it touches the resistance levels and starts then moving downwards.

The main advantage of trading a pullback is that you will be able to set your stop loss and take profit levels easily because of the already established levels of support.
The primary disadvantage is that you will be betting against the current underlying momentum. However, trading pullbacks are a tried-and-tested strategy and are deemed to be among the high-probability patterns.
Breakout
A breakout is the opposite of a pullback in that it occurs when the resistance or support levels do not hold.
This means that the price breaks through these levels and continues on its underlying trend. If the price was previously moving in an uptrend, it will break through the resistance level and continue on an uptrend for a breakout to happen.

The primary advantage here is that you will be trading on the underlying momentum and that a breakout suggests the continuation of this trend for a longer period of time.
The main disadvantage is that there are often fake breakouts, where a stock seems to break out for a while but then pulls back, and the trend reserves. Therefore, if you’re trading breakouts, you should always ensure that you have a stop loss to ensure that you will minimize your losses if it was a false breakout.
Failure Test
A failure test represents the traders on the other side of a false breakout. This strategy basically entails identifying false breakouts and then trading in the opposite direction, thereby taking advantage of traders who traded the breakout.
When the price inevitably pulls back, you make money, and this strategy has been proven to be a high-probability strategy. This is because there are several traders who may misjudge a false breakout and open positions, which represents the ideal opportunity for you.
Best Trading Setups for the Stock Market
A trading setup is different from a trading pattern. A pattern is only one part of the puzzle, indicating a potential buying or selling opportunity. In contrast, a setup is a list of rules and conditions that must be satisfied for the trade to be executed.
Below, some of the rules for ensuring that you have an ideal trading setup have been given.
Set the Right Stop Loss
Setting a stop loss at the right levels is crucial for a trader to minimize their risks and losses from a potential trade if they turn out to be wrong.
Contrary to popular belief, a stop loss should not be set at the point that represents the maximum money you are prepared to lose; rather, it should be at the point where the price movement is such that it indicates an incorrect trade. There are two main ways in which a stop loss can be set; a volatility stop loss and a structure stop loss.
A volatility stop loss has been set based on the volatility of the market. It is a multiple of a volatility indicator that the trader has selected for the particular trade. Based on this, a trader might set their stop loss to account for the market’s volatility.
However, since volatility indicators are based on past information, they might not be very reliable. They are considered to be a good way of identifying your buffer on a particular trade.
On the other hand, a structure stop-loss looks primarily at the price levels and sets the stop loss accordingly.
For example, if you are trading on a pullback from resistance levels, then the stop loss will be set a few points above the resistance levels, because if that is breached, then this would indicate that it is indeed a breakout, and therefore, you were wrong about the trade.
Your stop loss, in this case, should account for the possibility of a fake breakout too. A structured stop loss allows you to minimize the risks of your stop loss being triggered if you were right; however, it might cause problems in the case of a particularly volatile market since you will need to have a higher stop loss.
Using Confluence Correctly
As explained earlier, confluence is the additional supporting evidence provided when multiple forms of signals all point towards a particular trading pattern.
For example, if the prices touch support levels in a market with a general uptrend, then this is a confluence because the support levels and the trend movements indicate that the prices are going to move higher. Therefore, confluence can exponentially improve the probability of your trades being profitable, but they have to be used carefully to ensure that you are optimally taking advantage of them.
Your trading setup should not rely on greater than 4 confluences because this would limit the number of trading opportunities that you get and impact your profitability in the long run. Granted, a higher number of confluence factors would keep increasing your profitability. Still, after a certain level, all they will do is ensure that you are only trading on extremely low-risk plays, limiting your market edge.
Example of Stock Trading Patterns
A simple trading setup that will demonstrate the importance of these factors has been discussed below. This will enable you to further your understanding of the concepts discussed above and provide you with a practical glimpse into how high-probability trading opportunities can be spotted.
Trading Setup
For this trading setup, the following rules will be observed:
- The general trend of the market should be in confluence with our support and resistance levels. This means that in a bull market, a long position will only be taken at the support level, and in a bearish market, a short position will only be taken at the resistance levels. The moving average indicators will be used to denote the general trend.
- Pullbacks will be traded, keeping into account the possibility of false breakouts. This ensures that there will be a designated level for setting the profit levels, which will be the resistance levels.
- The position will be held until either the stop loss has been triggered or the take profit levels are achieved. This ensures discipline and avoids emotion-backed tweaking to the trade, such as extending the stop loss to hold on to a losing trade.
Example Trading Setups
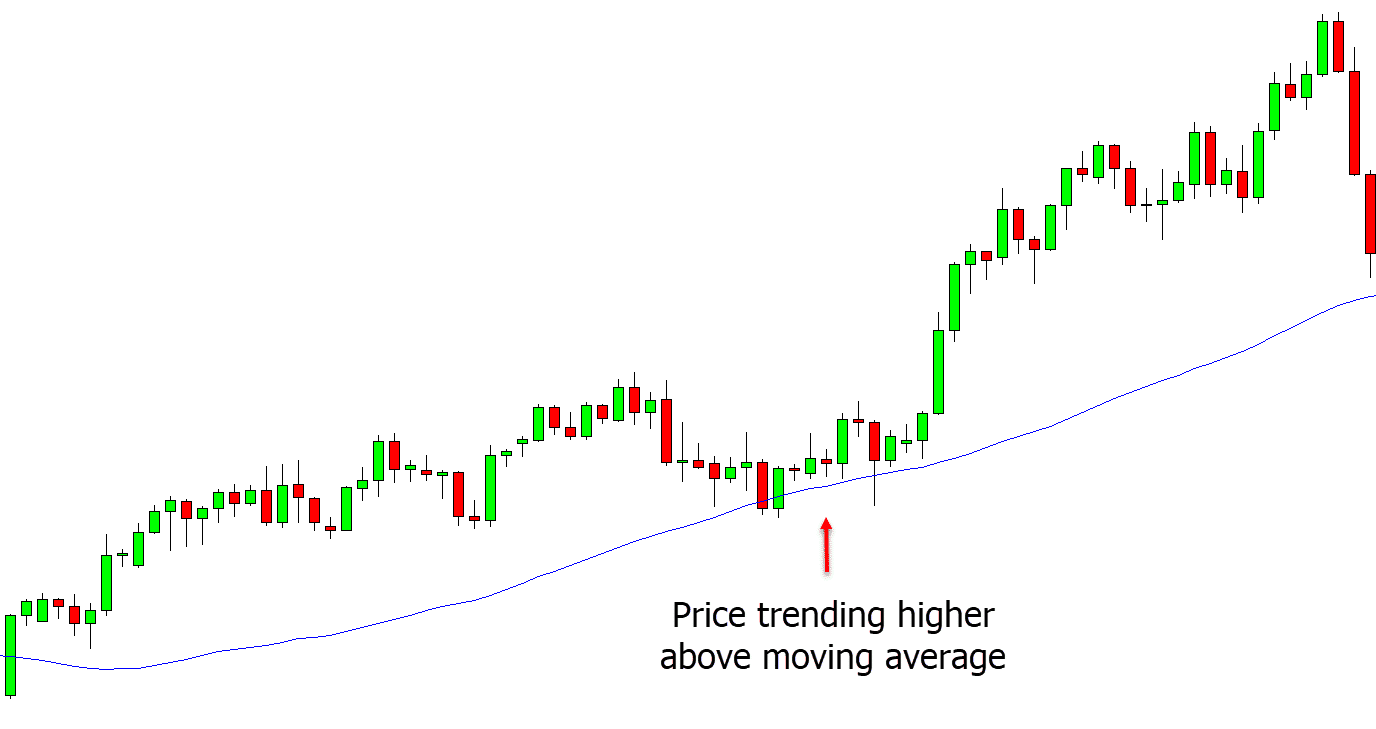
The chart below represents a trading opportunity that conforms to the trading setup discussed above.

The moving average indicator, used for calculating the simple average of the closing prices for the previous 200 days, indicates that the stock price is currently in an uptrend, which can also be ascertained by looking at the stock price graph.
This means that only the support levels will be traded. When these levels are hit, it is important to wait and see whether a false breakout happens or the support holds.
If the stock price breaches this price, there is a breakout that does not conform with the trading setup. If the support holds, then we can look to make long trades.
NOTE: You can get your free high probability trading setups PDF below.
Lastly
In conclusion, many factors have to be considered to determine whether or not a particular trading pattern qualifies as a high-probability trading opportunity.
These include establishing the support and resistance levels, identifying the right trading pattern, looking at confluence factors, and identifying the right stop loss points for your trade. While one high-probability trading setup has been provided for your benefit, you need to create your own setup based on your risk profile, level of comfort with different indicators, as well as personal preferences.
All that matters is that you continually tweak your setup to capture and identify the trading opportunities with the highest probability of success in the market.

Nishit is an accounting and finance student at the University of Warwick who has written for a range of blogs and websites including Fortune 500 companies.
He has a passion for the financial markets and has been a keen investor since he was 15.