Being able to find repetitive patterns and trade them consistently is key to successful trading.
The price movement in any market is repetitive in nature because the human nature that causes market cycles hasn’t changed for a million years. For that reason, having a trading strategy that lets you identify recurring trading patterns that appear regularly is all that one needs to find consistency in this game.
In this trading guide, we go through the concepts of fractal trading and how fractals can help you regularly pinpoint potential reversal signals.
NOTE: You can get your free Fractal trading strategies PDF below.
What is a Fractal in Trading?
Fractals are repetitive price patterns that are self-similar across different time frames. The term “fractal” is derived from the Latin word “fractus” which can be translated as fragmented or broken.
The most famous fractal is the Mandelbrot set, named after the Polish-born French-American mathematician Benoit B. Mandelbrot. The Mandelbrot set has the characteristic properties of a fractal.
The stock market is fractal because all price changes are distributed in repetitive patterns. According to Benoit B. Mandelbrot, all things have fractal nature, and similarly, stock prices also appear to move in patterns that repeat across all time frames.
Bill Williams Fractal
You can find fractal patterns by using the fractal indicator developed by veteran trader Bill Williams. You may also know Bill Williams from some of his other popular indicators like the Alligator indicator.
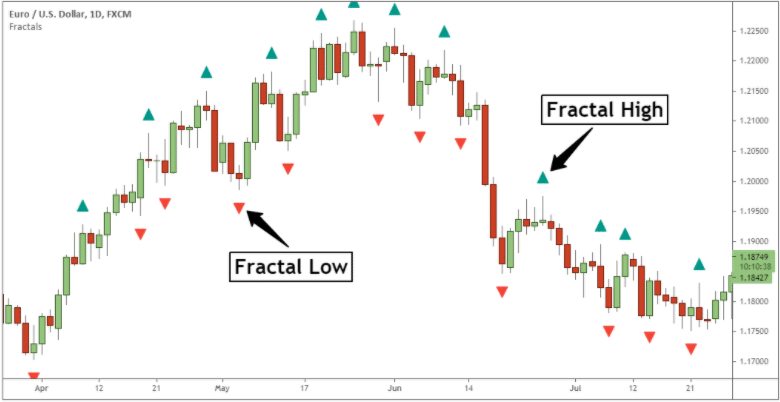
The fractal indicator is designed to mark on the price chart a specific five candlestick pattern which is aimed to spot swing lows and swing highs in the market:
- A fractal swing high is marked on the price chart with an up arrow and is made of five candles where the middle candlestick has the highest point of the pattern, whereas the outer two candles to the right and the two candles to the left have lower highs.
- A fractal swing low is marked on the price chart with a down arrow and is made of five candles where the middle candlestick has the lowest point of the pattern, whereas the outer two candles to the right and the two candles to the left have higher lows.
Note* Traders need to keep in mind that according to Williams, fractals can also be formed by 3 candlesticks.
The fractal arrow will only be printed above (below) the middle candle of the five candle price formation.
The fractal indicator is a repainting indicator because the indicator’s value is based on future prices as well. Bill Williams’ Fractals needs 5 candles to display an arrow, and two of the candles used are always going to be in the future relative to the current one.
Fractal analysis is used to determine short-term price reversals. The bullish fractal signal is used to determine when the price is going to reverse to the upside. At the same time, the bearish fractal pattern is used to determine when the price will reverse to the downside.
NOTE: You can get the best free charts and broker for these strategies here.
Bill Williams MT4 Fractal Indicator
The fractal indicator is an inbuilt technical indicator on most trading platforms.
You can download for free the Bill Williams fractal indicator MT4 HERE. Apply this indicator to the price chart, and the indicator will highlight the fractal patterns (up arrow and down arrow).
Fractals Trading Strategy
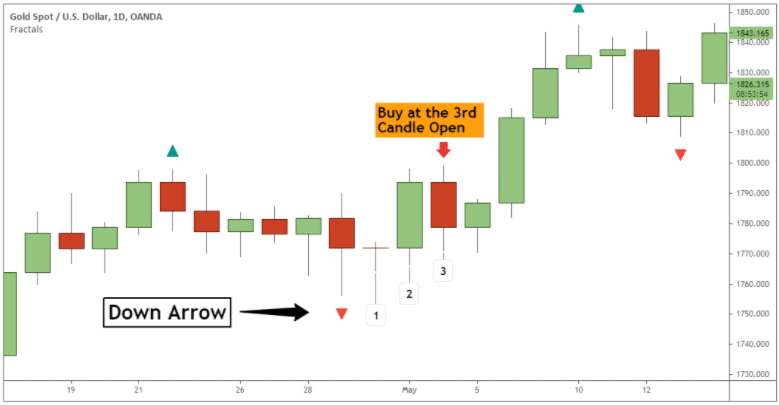
The easiest way to use the fractals trading strategy is to sell on up arrows and buy down arrows. However, the buy and sell signals can only be triggered at the open of the sixth candle or the third candle after the arrow.
The fractal trading system is only good to anticipate good entries for short-term price reversals. It’s up to the trader how each position is managed.
Based on the fractal trading strategy, the protective stop loss should be placed:
- Above the up arrow for sell signals.
- And below the down arrow for buy signals.
Basically, the stop loss order is placed above/below the middle candle high/low. Traders can use a trailing stop loss to lock in profits, or traders can wait for an opposite fractal pattern to be printed on the price chart to close the trade.
Fractal Flow Strategy
The fractal flow strategy revolves around combining three key concepts:
- The overall market trend.
- Fractal pattern.
- And momentum divergence.
When momentum divergence is combined with the fractal candle, there is an opportunity to have more powerful price reversal signals. The meat of the fractal flow strategy is trading in the direction of the predominant trend. At the same time, the fractal reversal patterns combined with the momentum divergence are simple tools used to time the market.
The momentum divergence side of the fractal flow strategy depicts when the price action lags behind the momentum readings. Fractal patterns aren’t always leading to a reversal. In this regard, the momentum divergence is a useful tool to confirm price reversals alongside the fractal indicator.
The RSI technical indicator is one of the most popular tools used to spot momentum divergence signals. A divergence signal happens when the price action makes a new high (or a new low), but the momentum readings fail to print a corresponding high (or low) to match the price action.
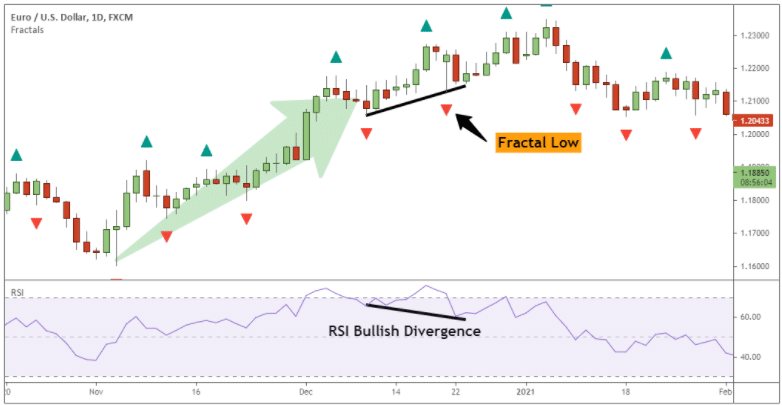
With the fractal flow strategy, a buy signal is generated when these three things happen:
- The predominant trend is bullish.
- A down arrow is printed below the price.
- An RSI bullish divergence occurs when the fractal low is formed.
Like it’s the case with the standard fractal trading strategy, the protective stop loss order goes below the fractal low.
Conversely, the sell signal occurs when the predominant trend is bearish, an up arrow is printed above the price, and the RSI bullish divergence occurs when the fractal high is printed.
Fractal Scalping Strategy
Another way one can use the fractal indicator is for scalping. Getting in and out of the market multiple times a day is extremely easy with the fractal indicator because it prints multiple fractal signals throughout the day.
On its own, the fractal indicator generates too many trade signals, and some of them won’t be that reliable. The fractal reversal signals are more reliable on the higher time frame, but on intraday charts, we need additional confluence factors before we can pull the trigger.
If you want more consistent results, you can use the fractal indicator in combination with a moving average.
How to Combine Fractals with Moving Averages
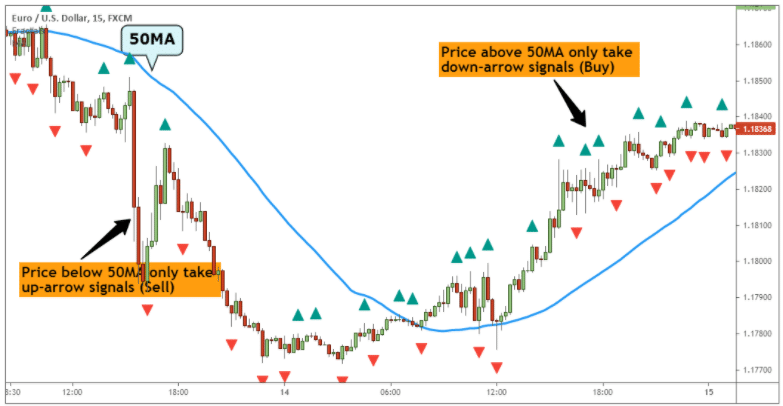
The 50-period moving average is used in combination with the fractal indicator to identify the trend direction.
Trading with moving averages is easy. If the price of a security is trading above the 50 moving average, we’re in an uptrend. Conversely, if the prices are below the 50 moving average, we’re in a downtrend.
Here is how we’re going to filter out most of William’s fractal signals:
- When the price is trading above the 50 moving average, we’re only going to take the bullish fractals with a down arrow below them.
- When the price is trading below the 50 moving average, we’re only going to take the bearish fractals with an up arrow above them.
Here is a chart example.
Fractal Breakout Strategy
Another way to use the fractal indicator is to spot potential breakouts. According to the developer of the fractal indicator, Bill Williams, if the price breaks above (below) the highest (lowest) point of a previous fractal, it constitutes a signal to buy (sell).
The fractal breakout strategy follows a simple three-step process:
- Mark down the level that comes from the last significant fractal high (fractal low).
- When the price approaches this fractal again, it will be used to trigger an entry order.
- A buying opportunity is signaled when the price breaks above the previous up arrow.
- A selling opportunity is signaled when the price breaks below the previous down arrow.
If you want to trade on the conservative side, it’s advised only to take those breakout signals where the price closes above the previous fractal pattern.
If the price action leading to the breakout displays one-sided price movement, this can be decoded as the fingerprint of smart money activity. When smart money drives the price, it can be visible on the chart through the big momentum candles.
Experienced traders won’t have trouble spotting these breakout signals.
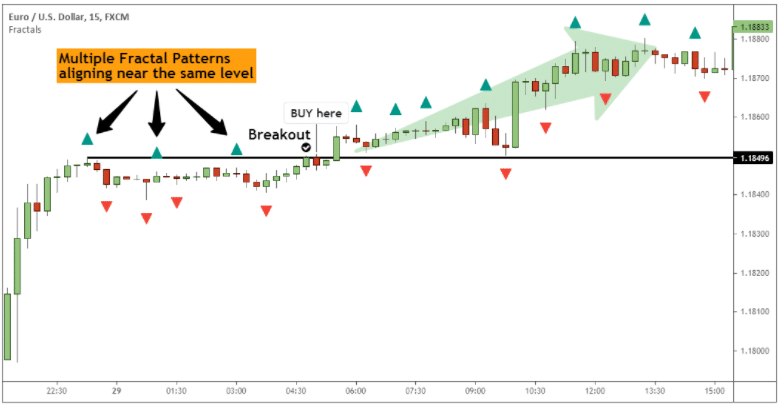
If multiple fractal patterns align at the same price level, it signals a strong resistance or support level. In this case, a breakout has the potential to trigger a bigger price movement. To increase the probability of the breakout signals, traders can patiently wait for multiple fractal arrows to align near the same price level.
Lastly
The key takeaway from this trading guide is that Bill Williams fractal indicator can be used in several ways. No matter your trading style, there is a trading strategy that you can safely use alongside the fractal indicator. One of the hallmarks of the fractal pattern is its simplicity.
On its own, the fractal indicator is rather easy to use. Still, it tends to generate many false signals, which is why it’s recommended to be used in combination with price action and other technical indicators.
NOTE: You can get your free Fractal trading strategies PDF below.

Stelian is an aggressive, success-driven, and highly collaborative entrepreneurial trader with 13 years of experience trading within financial markets.
Stelian is a disciplined investor with a passion for trading and a solid understanding of global markets.