Using the daily chart to identify buying and selling points in the stock market can help traders hold onto their shares despite the intraday noise.
Beginner traders need to first find success trading the daily timeframe before jumping into the fast-paced world of day trading.
This stock trading guide will break down how to trade the daily chart and become better at timing the market.
What is Daily Chart Trading?
Daily chart trading analyzes the stock market and executes trades based on the price action from the daily timeframe.
On the daily chart, a new candlestick is printed on the chart every 24 hours. In other words, each candlestick represents the trading activity for the entire day.
This gives stock traders enough time to think and analyze the market. The daily chart cuts through the intraday noise and gives stock traders a better perspective of the underlying trends.
No matter the time frame used, all charts provide stock traders with the same type of information – i.e., the open, high, low, and closing prices.
However, the daily OHLC prices usually carry more weight, especially the daily closing price.
Put simply; the daily closing price is the last price a stock trades at 4:00 PM EST when the stock market is closing.
Some reasons why the daily chart will improve your trading include;
- More time to make better trading decisions.
- Less stressful compared to day trading.
- Less trade frequency, thus the quality of the trades is better.
- Through compounding, stock investors can maximize their daily returns.
The downside of trading the daily chart is that stock traders are exposed to overnight risks.
Daily Chart Trading Strategies
The daily chart trading strategies offer traders an excellent opportunity to open long-term positions with their favorite stocks. Traders using the daily timeframe regularly use fundamental analysis or technical analysis to assess the overall market direction and to time the market.
The stock trading strategies listed below are most popular among retail traders to predict future price movements.
NOTE: You can get the best free charts and broker for these strategies here.
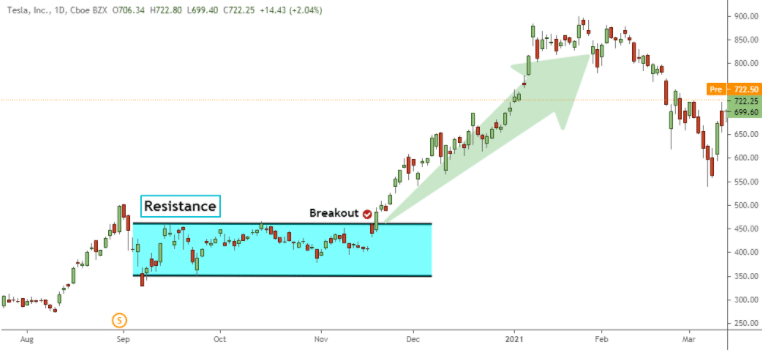
Breakout Trading Strategy
A breakout in a particular stock price is a trading opportunity that some active stock traders can develop a whole strategy around.
In general, a breakout occurs when the stock price moves beyond a key price level that provided some resistance in the past.
Key price levels in the stock market represent support and resistance levels, previous swing high or swing low, pivot points, key moving averages, etc.
A breakout can signal that the share prices are about to make a sizable move.
For example, when the stock price breaks above a key resistance level, it often signals an explosive move to the upside. If the breakout is accompanied by increased volume, the signal carries more weight than breakouts that lack volume.
Support and Resistance Strategy
Support and resistance trading is one of the most popular technical analysis techniques used by stock traders. Support and resistance levels can help traders identify if shares prices are more likely to rise or fall.
In technical analysis, a support level is a price level of buying interest at which the stock price struggled to move beyond it. Stock traders can decide to buy at this price level and profit from the potential increase in the price.
Conversely, a resistance level is a price level of selling interest at which the stock price struggled to rise further. Stock traders can decide to short sell at the resistance level and profit from the potential fall in the share price.
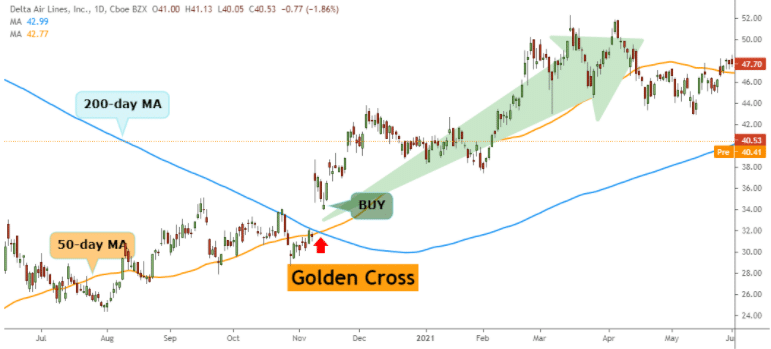
The Golden Cross and Death Cross Strategy
In technical analysis, the golden cross signal occurs when the 50-day moving average crosses above the 200-day moving average.
When a stock price records a golden cross, it’s usually a bullish signal that anticipates a rise in the stock price.
By contrast, the death cross is the opposite of the golden cross signal. The death cross signal occurs when the 50-day moving average crosses below the 200-day moving average.
When the stock price experiences a death cross, it’s usually a bearish signal that anticipates a fall in the stock price.
Positional Trading Strategy
Stock position trading is a type of long-term investing strategy where stocks are held from weeks to months.
Positional trading is the best example of daily chart trading because position traders are not as concerned with the intraday noise as with the big picture trends from the daily timeframe.
Swing Trading the Daily Chart
The swing trading techniques work best when they are applied to the daily chart.
In this section, you’ll learn swing entry signals based on the end-of-day closing prices. The final price at which a stock trades is more important than the open, high, or low prices because it gives insight into the general mood of the market and who won the bull-bear battle.
To take advantage of the daily closing prices, stock traders need to open a position within the last 30 minutes of the trading day.
For example, if the stock price closes at a new 10-day high, traders can buy the stock before the closing price. This will ensure stock traders won’t miss the move if the stock prices gap the following day.
Another swing entry method is to trade on the next morning open.
The stock prices move in a natural rhythm that is made up of bullish and bearish days.
Some research has shown that if the stock price closes in the top/bottom 20% of its daily range, there is a high probability the following day will be a reversal.
Stock market veteran Linda Raschke popularized this method in the book “Street Smarts.”
This swing trading technique requires following a 3 step process (for buy positions).
- Yesterday the stock price opened in the top 20% of its daily range and closed in the bottom 20%.
- Presently, the stock price needs to trade 5 – 15 ticks below yesterday’s low.
- Open a long position when the stock price moves beyond yesterday’s low.
Daily Chart Trading Examples
Breakout Trading Example
Support and Resistance Example

Golden Cross Signal
Trading the Open Example

Lastly
Trading on the daily chart appears to be simple.
However, it requires performing a detailed technical analysis of the price action and an in-depth understanding of the stock market.
Price action can be analyzed on multiple timeframes, but the daily chart continues to be more relevant than intraday charts.

Stelian is an aggressive, success-driven, and highly collaborative entrepreneurial trader with 13 years of experience trading within financial markets.
Stelian is a disciplined investor with a passion for trading and a solid understanding of global markets.