The relative strength index, or RSI as it is known, is a momentum indicator that you can use with your technical analysis.
While you can use the RSI by itself in your trading, you can also use it to find and trade divergence.
In this post, we go through exactly what the RSI is, how to trade it, and find RSI divergences.
NOTE: You can get your free RSI divergence cheat sheet and PDF below.
What is the RSI?
The relative strength index is an indicator that looks at the recent change in price to identify overbought and oversold market conditions.
You can use the RSI in many different markets and your different time frames.
When you are using the relative strength index, it will add an oscillator to the bottom of your chart.
This oscillator moves between the low and high to show whether a market is neutral, overbought, or oversold. The reading with this oscillator ranges between 0 and 100.
When the RSI is showing a reading of 30 or below, it is thought that the price is oversold.
On the other hand, if the reading is 70 or above, it is thought that the price is overbought.
As you can see, the RSI is a straightforward indicator that you can quickly use to find potential trades where there is an extreme of overbought or oversold market conditions.
How to Trade RSI Divergence
Divergence occurs when a disagreement between an indicator and the price action starts happening.
The principal divergences you can use in your trading are;
- Regular bullish divergence.
- Regular bearish divergence.
- Hidden bullish divergence.
- Hidden bearish divergence.
An example of divergence would be if the price was in an uptrend and the price was making a higher high, but the indicator is not showing a discrepancy between the two.
Using divergences, you can identify and react to the change in price action to either help you make a trade or start protecting your profits.
This post looks specifically at RSI divergences and how you can use them in your trading.
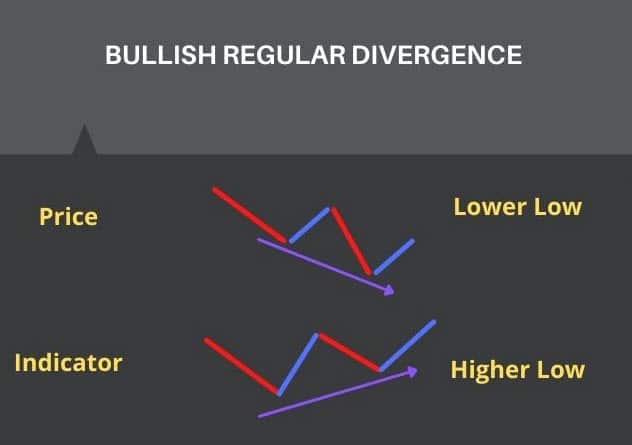
Regular Bullish Divergence RSI
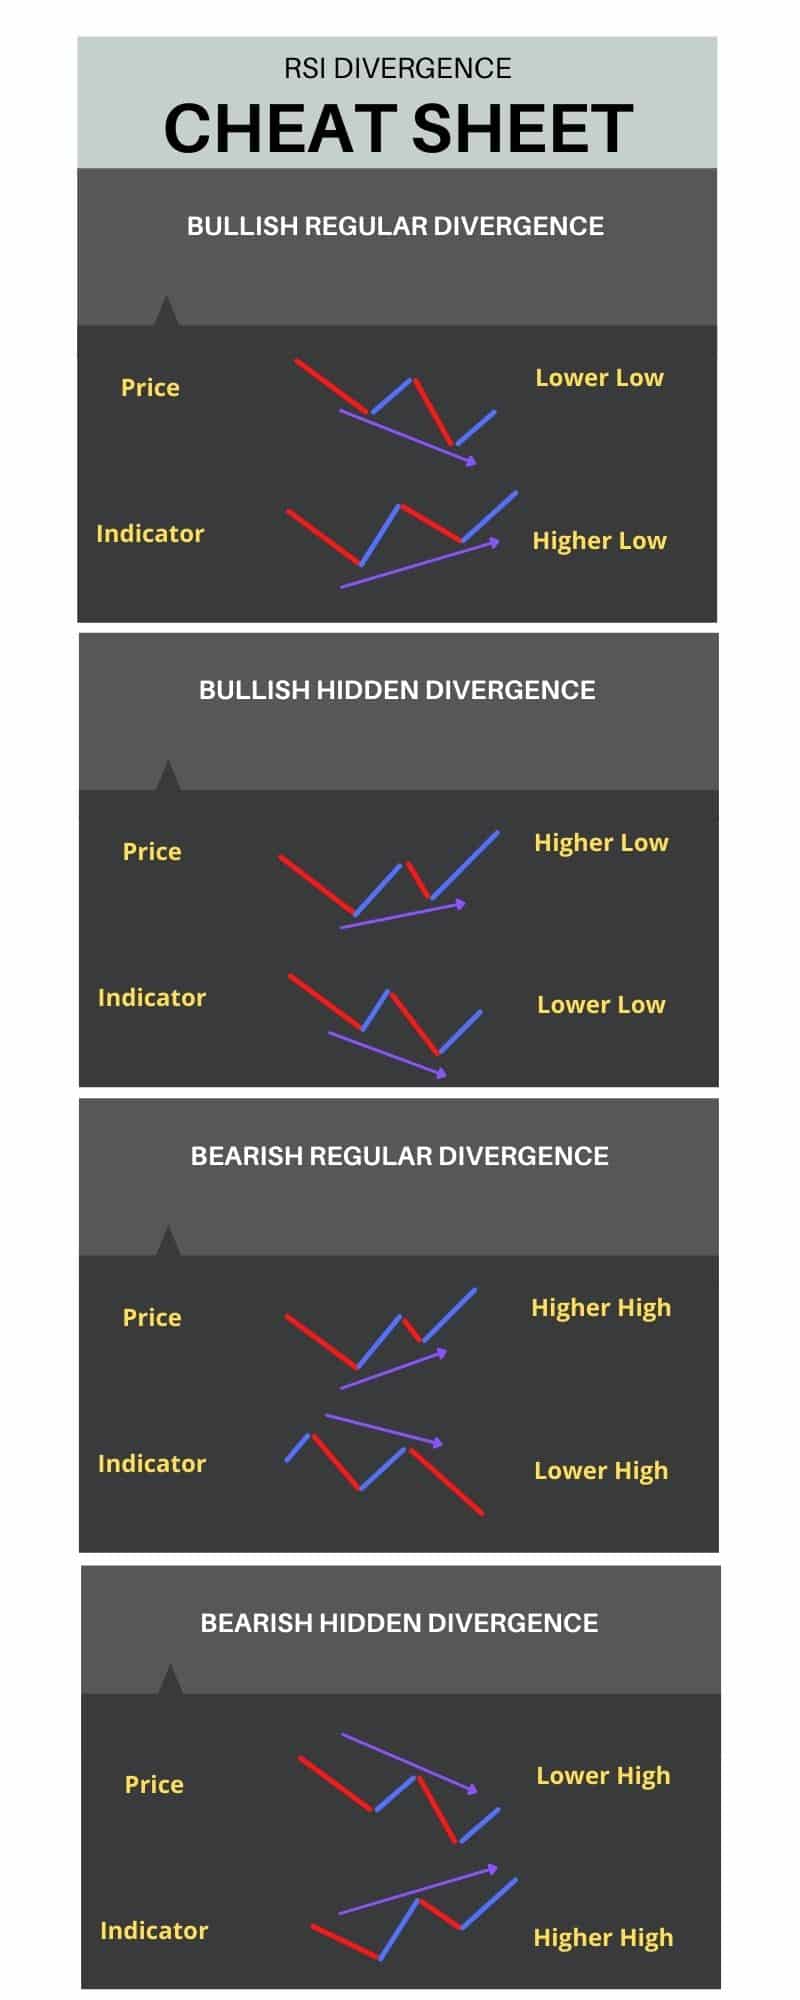
Regular bullish RSI divergence can be found when price action is making lower lows, but the RSI indicator is starting to make higher lows showing a discrepancy in the price action and the RSI.
In the image below, you will see that while the price is making a lower low, the indicator is making a higher low, showing a divergence between the price and the indicator.
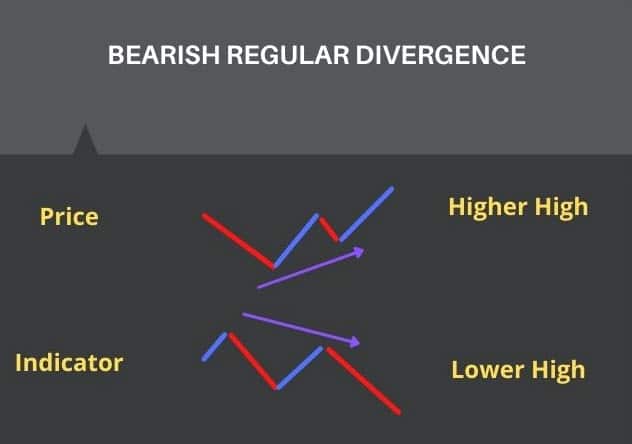
Regular Bearish Divergence
Regular bearish RSI divergence works the same way as regular bullish divergence but in reverse.
You can spot regular bearish divergence when you see the price action making a series of higher highs, but the RSI indicator is starting to make lower highs.
The image below shows how the price action is forming higher highs, but the indicator is starting to form lower highs showing a divergence.
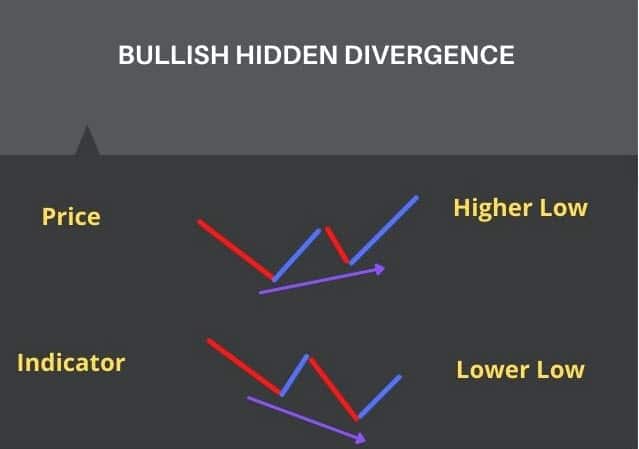
Hidden Bullish Divergence
Hidden bullish divergence occurs when the price is starting to form higher lows, but the indicator is starting to make lower lows.
You will often see hidden bullish divergences in your chart when the price has been ranging, or there is a pullback in an overall trend.
The image below shows how the price is forming higher lows; however, the indicator is starting to form lower lows.
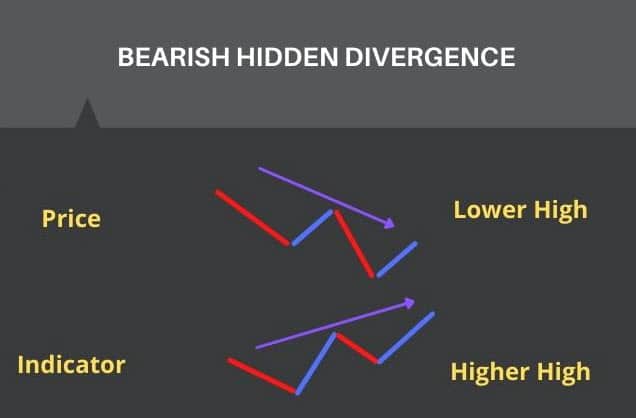
Hidden Bearish Divergence
The last type of divergence is hidden bearish divergence.
This type of divergence occurs when the price action forms lower highs, but your indicator is making a higher high.
In the image below, you can see how while price action forms a lower high; the indicator is starting to develop a higher high, showing hidden bearish divergence.
This pattern is often formed in a downtrend and hints that the price action will continue the trend lower.
RSI Divergence Cheat Sheet
Now that you are aware of the main types of divergences that you can use in your trading, you probably want a cheat sheet that you can use to remember the different types of divergence quickly.
Below you can download an RSI divergence cheat sheet PDF that will quickly help you remember the different types of divergence.
NOTE: You can get your free RSI divergence cheat sheet and PDF below.
Lastly
To start with, using RSI divergences can be pretty confusing. While there are only four main types of divergences, there are many parts, and it can take some time to familiarise yourself with them all.
After a while, spotting the different divergence will become a breeze, and you will be able to use them to find and manage your trades.
NOTE: You can get your free RSI divergence cheat sheet and PDF below.
Stock Markets Guides content team.