In theory, the market is highly efficient, and buyers and sellers are rational market players. This means that they will only sell a security when they believe it to be overpriced and will buy only undervalued securities. This is not the case in reality, with most traders and investors being emotionally driven.
Two of the primary emotions that drive behavior in the market are greed and fear. The fear and greed index is a useful tool for identifying the market sentiment and making trading decisions.
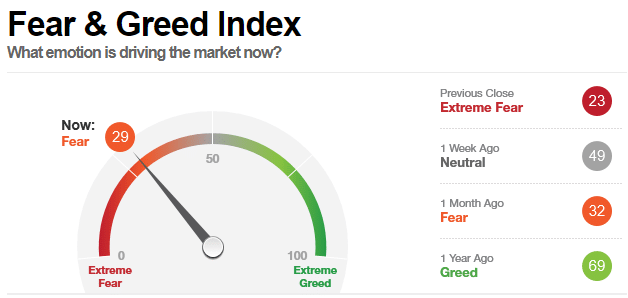
What is the Fear and Greed Index?
Developed by CNN Money, the Fear and Greed Index is a tool that measures two of the primary emotions that might drive prices up or down in the market: fear and greed.
The underlying assumption is that fear would drive share prices by encouraging shareholders to sell, whereas greed would drive prices up in anticipation of gains. The fear and greed index can be used to analyze whether or not the market is fairly priced at any given moment. It can be measured on a daily, weekly, or even yearly basis.
How do You Use the Fear and Greed Index?
The Fear and Greed Index is based on two different values: the intrinsic price of a security and the price it is currently trading.
If these values are different, this represents a trading opportunity that could result in profit for the trader. While some level of greed and fear is always present in the market, the unbridled nature of these emotions might make for securities trading at prices other than their intrinsic prices.
Most Fear and Greed Indexes use several factors to arrive at a final value, which is between 0 and 100.
There are several advantages and disadvantages to trading using the Fear and Greed Index.
The major advantage is that it does not merely rely on the security value itself but also incorporates market sentiments into the strategy. However, this is also a disadvantage of the strategy, as critics say it places too much importance on market sentiments and is a market timing strategy instead of a proper buy-and-hold strategy.
Another advantage that the Fear and Greed Index offers is that it has been known to be a reliable indicator. This means that if you can use it right, it can be a part of a very successful trading strategy. Critics counter this by saying that behavioral economics and finance, which form the basis for the index, are inexact at best and promote erratic behavior in the stock market.

Regardless of the arguments put forward by either side, the Fear and Greed Index is a very widely used indicator.
NOTE: You can get the best free charts and broker for these strategies here.
Fear and Greed Index Chart
As mentioned earlier, the Fear and Greed Index gives a value between 0 and 100, indicating the level of fear or greed in the market.
Usually, traders have a safe range that they use, and they only treat it as a signal if the value of the index goes out of this range. For example, if your safe range is 25-75, you would consider the market to be oversold when the value of the index goes below 25. This would indicate that securities in the market are trading below their intrinsic value, representing a buying opportunity.
Similarly, an index value of above 75 would indicate unbridled greed and represent a selling opportunity as securities are now overbought. The two ends of the Fear and Greed Index are called Extreme Fear and Extreme Greed, respectively.
CNN Fear and Greed Index
The Fear and Greed Index developed by CNNMoney uses 7 different factors to arrive at the final number for the index. Each of these factors provides valuable information about the sentiments of the market and have been listed below:
- The stock price momentum is basically the current value of the S&P 500 index compared to its 125-day moving average. If the difference is low, this indicates low market volatility, reducing the possibility of excessive fear or greed.
- The stock price strength looks at all the stocks hitting yearly highs and lows on the NYSE. If several stocks are hitting yearly highs, this is a potential indicator of the market being overbought. On the contrary, if stocks are hitting yearly lows, this could mean a high degree of fear and represent a buying opportunity.
- The stock price breadth analyses the volumes in rising and falling stocks to identify which side has the higher momentum.
- The extent to which call and put options surpass each other. For example, if the value of a put option lags behind that of a call option, this would indicate greed, as more people are betting on an increase in the underlying asset price. On the contrary, if a put option’s value surpasses that of a call option, this would indicate a high level of fear in the market.
- The demand for junk bonds as compared to investment-grade bonds. If there is an increasing demand for junk bonds, more people are opting for higher-risk strategies, indicating high levels of greed. At times of turmoil and fear, people fall back on safer options and opt for investment-grade bonds with little to no risk.
- The 50-day Moving Average of the VIX is also a useful indicator in measuring the market’s volatility over time.
- The demand for safe investments as compared to risky ones, measured by the difference in returns on stocks compared to those on treasury bills. In times of high greed, there is a higher demand for stocks and higher returns.
By combining these 7 factors, CNN can provide a highly accurate estimate of the level of fear and/or greed in the market at any given time.
Fear and Greed Index vs S&P 500
The level of the Fear and Greed Index and the S&P 500 are highly correlated and interdependent. As detailed above, the first factor in ascertaining the Fear and Greed Index level is to look at the momentum on the S&P 500. At the same time, the value of the index also influences market behavior, having a cyclical effect.
For example, suppose the S&P 500 is oversold, and its value is steadily declining due to a glut. This will result in a low score on the Fear and Greed Index, indicating to traders that there is a strong opportunity to buy stocks now.
This will begin propping up prices, and as more people buy, the market will turn bullish. Eventually, the market will go from being oversold to overbought, leading to a higher score on the Fear and Greed Index, and the process will reverse.
This cycle continues constantly and is an important part of the economic cycle.
Crypto Fear & Greed Index
Similar to a stock Fear and Greed Index, there is a Fear and Greed Index for cryptocurrencies, too, published by the website Alternative.me. It is based on the principle that cryptocurrency markets are emotion-driven.

The index works on many of the same fundamental ideas and can identify when cryptocurrencies are undervalued and when the market is due for a correction.
Lastly
The Fear and Greed Index is a useful indicator of market sentiments, and despite its many criticisms, it is relied upon by several traders.
Developed by CNNMoney, it uses a combination of 7 factors to give a value between 0 and 100, which can then be used in various trading strategies by the traders.
There is a high degree of correlation between the S&P 500 and the Fear and Greed Index, which leads to market cycles and corrections. There is also a Cryptocurrency Fear and Greed Index that works on the same principle as stocks.

Nishit is an accounting and finance student at the University of Warwick who has written for a range of blogs and websites including Fortune 500 companies.
He has a passion for the financial markets and has been a keen investor since he was 15.