Technical analysis is the study of the price and volume of an asset. Technical analysis can at times be confusing with several types and techniques. Out of the many, price action, indicators, and candlestick patterns are the most popular ways to analyze charts and predict the market.
If observed, in all types of technical analysis, there is one common denominator. All these techniques help you understand the price movement, momentum, and volume of the market.
However, one such technical indicator purely considers the price and volume to determine how and where the money is flowing in the market.
Understanding the money flow in the market is critical for traders. The market is not simply the candlesticks that we see on the charts. There is logic and meaning to the formation of candlesticks.
If we dig deep into interpreting the markets, it all boils down to the buying and selling by the institutional players.
If you can comprehend the purchases and liquidations made by the big players, you can start to find high probability trades.
In this post, we go through exactly what the accumulation distribution indicator is and how to use it in your own trading.
What is the Accumulation Distribution Indicator?
The Accumulation Distribution (A/D) is a volume-based indicator that primarily represents the overall price direction of an underlying asset.
As mentioned previously, it considers the price and volume of the market and the money flow for it. Traders normally use this information for identifying potential reversals in the market, which will be discussed later in the article.
The name of the indicator is given thoughtfully. We know that the market moves based on the biggest investors buying and selling. And the indicator is designed to determine their actions. The term accumulation relates to buying, while distribution relates to selling.
The accumulation distribution is plotted as a line or bars.
The A/D values are obtained from the previous A/D value and the Money Flow Volume for the specified period.
The parameters are calculated as follows:
- A/D = Previous A/D + Money Flow Volume
- Money Flow Volume = Money Flow Multiplier x Volume of that period
- Money Flow Multiplier = {(Close Price – Low Price) – (High Price – Close Price)} / (High Price – Low Price)
Since the current A/D considers the previous A/D, the calculation is a cumulative measure. Technically, the accumulation distribution indicator combines the past money flow and current money flow and helps traders interpret the upcoming price action.
NOTE: You can get the best free charts and broker for these strategies here.
How Does the Accumulation Distribution Indicator Work?
The movement in the prices is based on the quality of buy and sell orders in the market. We could say that price follows volume. As the accumulation distribution indicates the money flow in the market, traders could examine the future trends in the markets.
There are four interpretations we can draw from the A/D line.
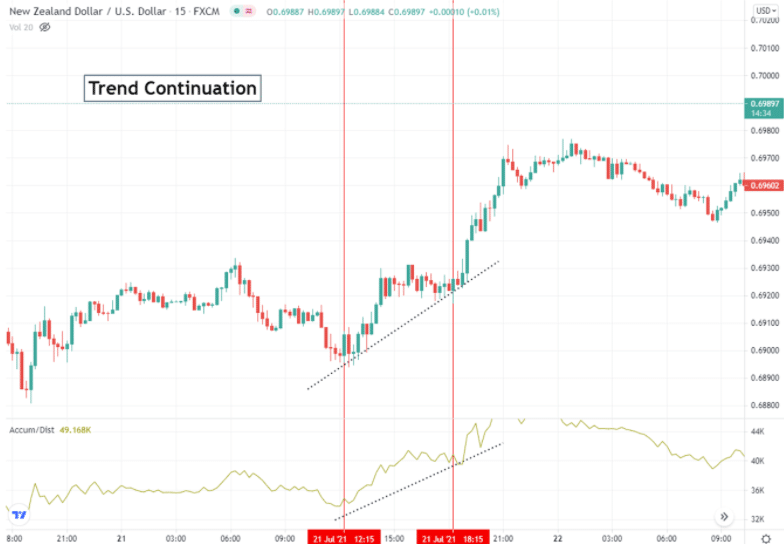
Trend Continuation
When both price and the A/D indicator make higher highs and higher lows, the bulls control the market, and a similar trend could continue.
When both price and the A/D indicator make lower highs and lower lows, the big sellers are considered to be going short, and hence traders could position themselves accordingly.
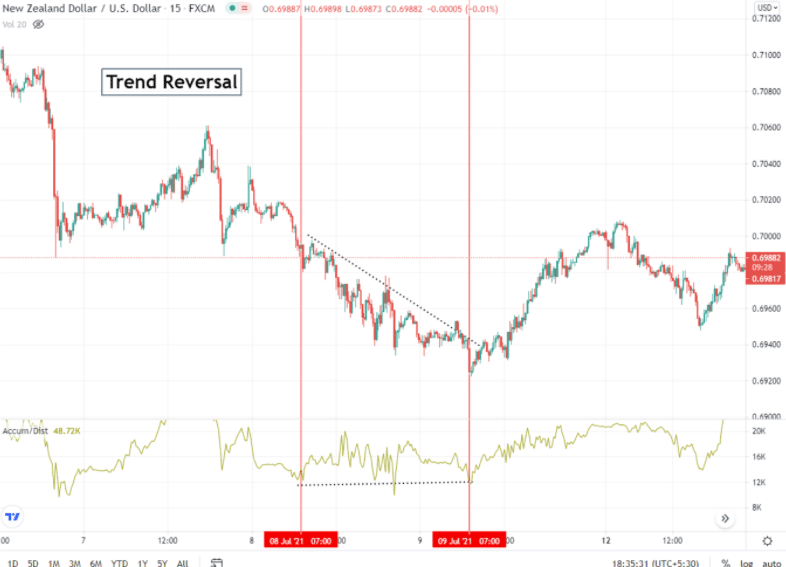
Trend Reversal (Divergence)
When prices are rising but the accumulation distribution is heading lower or moving sideways, it indicates a reversal to the upside.
Conversely, when prices are falling and the A/D is rising or ranging, it is an indication that the market is preparing to reverse south.
Accumulation Distribution Indicator vs On Balance Volume
The accumulation distribution and on-balance volume are volume-based indicators that measure the cumulative money flow in an underlying asset. The approach used to calculate the values, however, is different.
One major difference is that the on-balance volume factors in the previous candle close, while the accumulation distribution does not. The A/D focuses on the vicinity of the closing price compared to the asset’s trading range for a given period.
Accumulation Distribution Indicator Trading Strategies
The accumulation distribution is majorly used to catch trend continuations and reversals.
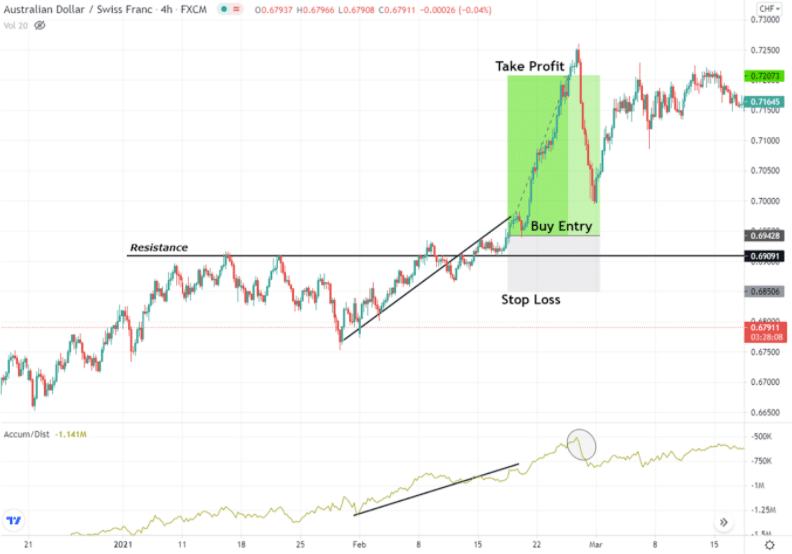
Buy Example
This example is a buy example which is essentially a trend continuation strategy.
A trend typically moves by making higher highs and higher lows. The recent highest high is referred to as resistance. Once the market breaks through it, the trend proceeds to make its next move higher.
The strategy revolves around the same idea. This strategy triggers a buy order in an uptrend when the market breaches above the resistance and the price action preceding it is in sync with the accumulation distribution line.
Your stop loss can be placed below the resistance, while you could exit when the indicator reverses in direction.
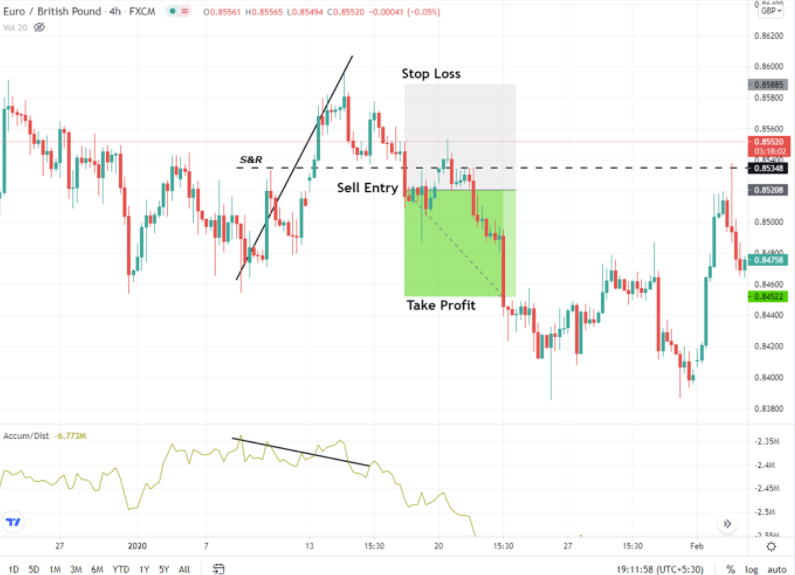
Sell Example
The accumulation distribution also gives clear indications of market reversals.
The accumulation distribution reversal strategy is a widely used strategy among traders. However, many fail to apply it the correct way. The strategy is powerful, but there are a few subtle considerations that need to be made beforehand.
With this strategy, you can go for a reversal buy/sell when the price is not correlated with the A/D indicator. For this strategy to work effectively, the market’s trend must be short in length and weak in momentum. When the market breaches through the nearest support or resistance you could anticipate a reversal.
Below is an example following the above criteria.
The stop loss for this trade can be placed above the recent highs and take-profit at the recent lows.
Accumulation Distribution Indicator MT4
The accumulation distribution can be easily downloaded for MT4 on the MQL5 website for free.
Once downloaded, it can be applied and used instantly, as all the functionalities and calculations are automated.
You can download the accumulation distribution indicator for MT4 here.
Accumulation Distribution Indicator MT5
The accumulation distribution can be easily downloaded for MT5 on the MQL5 website for free.
Once downloaded, it can be applied and used instantly, as all the functionalities and calculations are automated.
You can download the accumulation distribution indicator for MT5 here.
Lastly
The accumulation distribution is a very handy volume-based indicator. Since prices move based on the buying and selling of the larger players, the indicator can help you determine the inflow and outflow of money in the market.
Like many others, A/D is not a standalone indicator, and it is recommended that it be used in conjunction with other strategies and techniques to make it highly effective and profitable.

Stelian is an aggressive, success-driven, and highly collaborative entrepreneurial trader with 13 years of experience trading within financial markets.
Stelian is a disciplined investor with a passion for trading and a solid understanding of global markets.