PDF – Stock Market for Beginners
👉 Get Your Free Bonus Trading Strategy Here! Download Now Stock Markets GuidesStock Markets Guides content team. stockmarketsguides.com/
👉 Get Your Free Bonus Trading Strategy Here! Download Now Stock Markets GuidesStock Markets Guides content team. stockmarketsguides.com/
👉 Get Your Free Bonus Trading Strategy Here Download Now Stock Markets GuidesStock Markets Guides content team. stockmarketsguides.com/
If you’re trying to figure out how to master the alligator indicator trading strategy, then this is the video for you. Get this exact walkthrough and all the resources including the free Alligator indicator PDF guide mentioned in the video for free Click Here. …
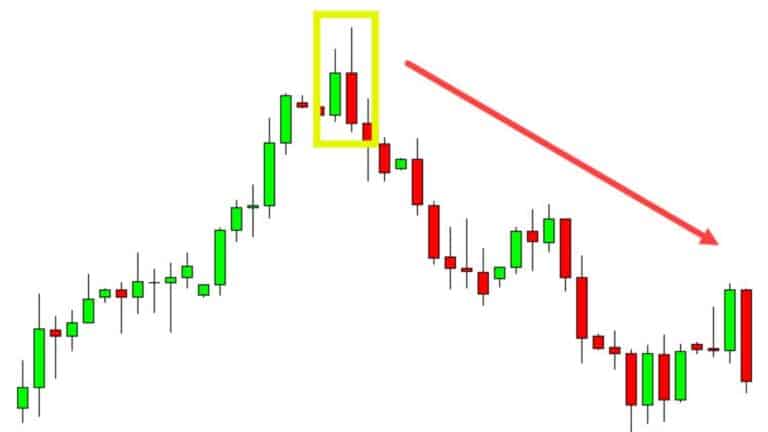
Candlestick patterns are some of the most powerful trading techniques you can use in our trading. These patterns can help you find bullish and bearish trades, and they can also help you manage your open trades. In this post, we’ll explore 35 powerful candlestick patterns …
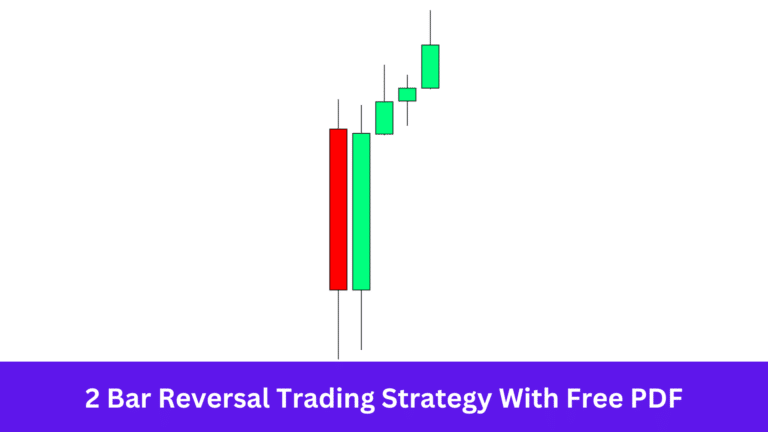
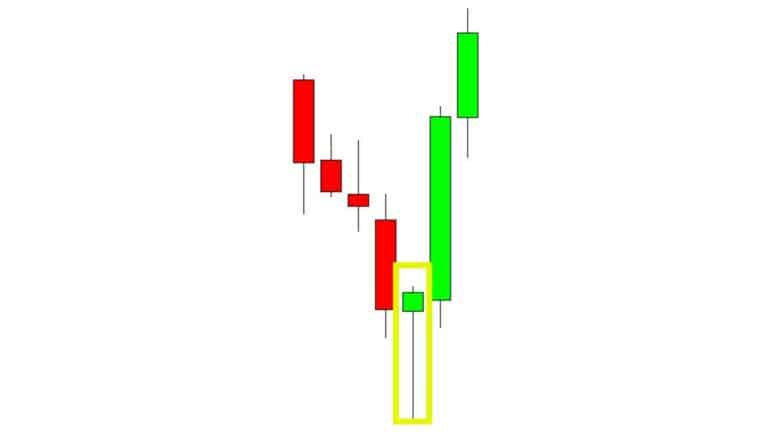
The 2 Bar Reversal is a trading pattern that signals a potential trend reversal. It involves two consecutive price bars: for a bullish reversal, the first bar is bearish (closing lower than it opened) and the second bar is bullish (closing higher than it opened), …
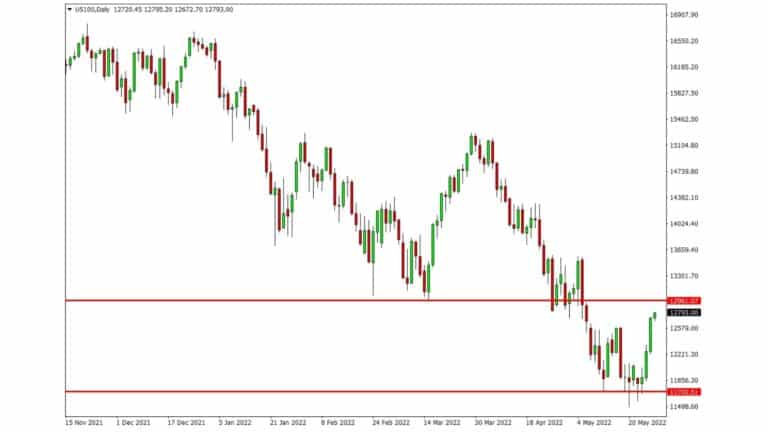
The Nasdaq is the second largest stock exchange in the world, attracting lots of traders. One popular way to trade the Nasdaq is by using technical analysis. Technical analysis looks at past price patterns and market trends to predict future movements. In this post, we’ll …
Some of the best trading strategies are often the most straightforward. While many traders try to overcomplicate their strategies and systems, the best strategies are usually those with clear rules that can be repeated repeatedly. This post lists some of the best trading strategies you …
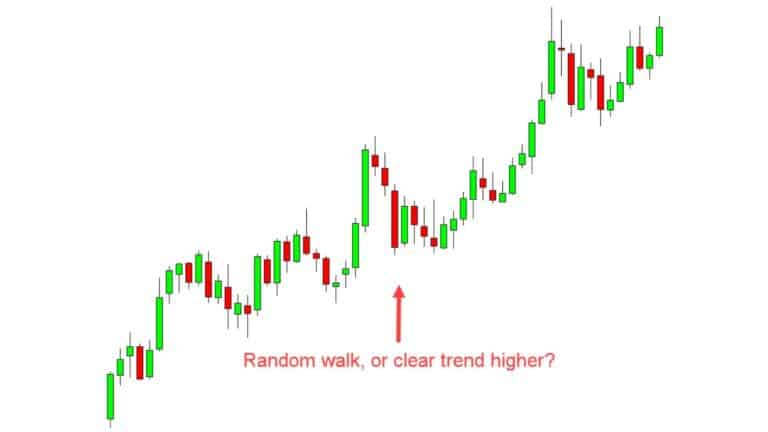
The random walk theory is a theory that has been debated for many years. Understanding how the random walk theory works can help you find better trading strategies in your trading. This post goes through exactly what the random walk theory is and how you …
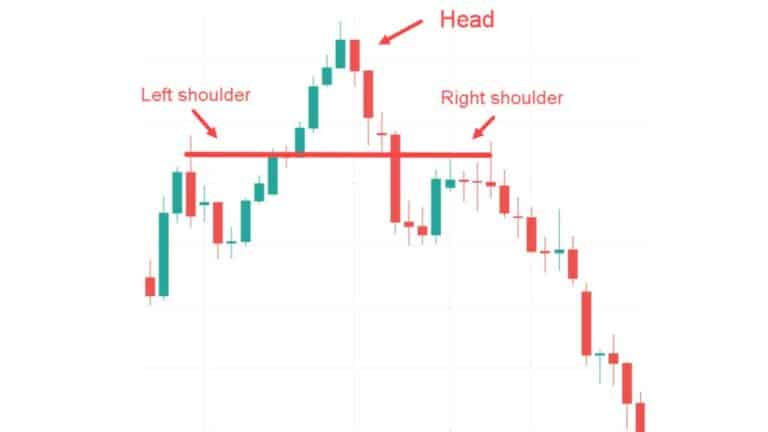
The head and shoulders pattern is a pattern that does not form often, but when it does, it can lead to highly accurate trades. The head and shoulders pattern is normally used on higher time frames, and you can use it to find potential reversal …
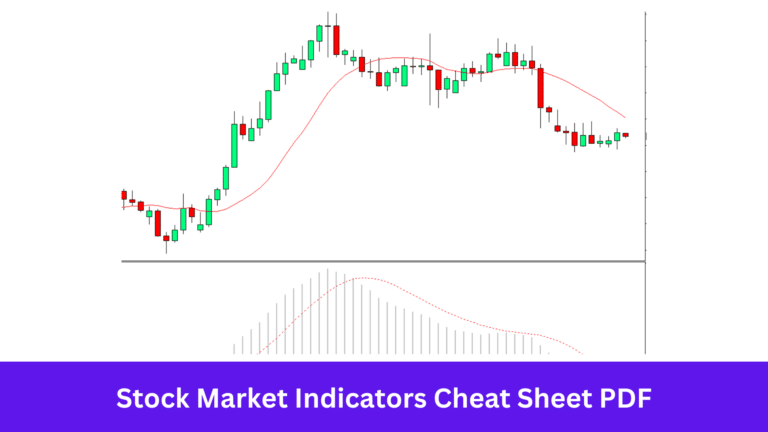
Stock market indicators are metrics or data points used to assess a stock market’s overall health and direction or specific segments within it. They help investors and analysts make informed decisions about buying, selling, or holding investments. This post reviews the most popular indicators and …